
HL Paper 1
The graph of is transformed onto the graph of by a translation of units vertically and a stretch parallel to the -axis of scale factor .
Write down the value of .
Find the value of .
The outer dome of a large cathedral has the shape of a hemisphere of diameter 32 m, supported by vertical walls of height 17 m. It is also supported by an inner dome which can be modelled by rotating the curve through 360° about the -axis between = 0 and = 33, as indicated in the diagram.

Find the volume of the space between the two domes.
Markscheme
= 33 A1
[1 mark]
M1A1
[2 marks]
volume within outer dome
M1A1
volume within inner dome
M1A1
volume between = 22 250.85 − 3446.92 = 18 803.93 m3 A1
[5 marks]
Examiners report
The graph of is given on the following set of axes. The graph passes through the points and , and has a horizontal asymptote at .

Let .
Find .
On the same set of axes draw the graph of , showing any intercepts and asymptotes.
Markscheme
M1A1
[2 marks]

-asymptote A1
concave up decreasing curve and passing through A1
[2 marks]
Examiners report
This question was not particularly well done. Candidates often failed to apply the transformation of the function correctly and did not understand how to use the algebra of graphical transformations. Others applied the geometry of stretches and translations, often incorrectly. Even if the graph was drawn correctly, some candidates failed to follow the instruction to show the asymptote.
This question was not particularly well done. Candidates often failed to apply the transformation of the function correctly and did not understand how to use the algebra of graphical transformations. Others applied the geometry of stretches and translations, often incorrectly. Even if the graph was drawn correctly, some candidates failed to follow the instruction to show the asymptote.
The strength of earthquakes is measured on the Richter magnitude scale, with values typically between and where is the most severe.
The Gutenberg–Richter equation gives the average number of earthquakes per year, , which have a magnitude of at least . For a particular region the equation is
, for some .
This region has an average of earthquakes per year with a magnitude of at least .
The equation for this region can also be written as .
Within this region the most severe earthquake recorded had a magnitude of .
The number of earthquakes in a given year with a magnitude of at least can be modelled by a Poisson distribution, with mean . The number of earthquakes in one year is independent of the number of earthquakes in any other year.
Let be the number of years between the earthquake of magnitude and the next earthquake of at least this magnitude.
Find the value of .
Find the value of .
Find the average number of earthquakes in a year with a magnitude of at least .
Find .
Markscheme
(M1)
A1
[2 marks]
EITHER
(M1)
OR
(M1)
THEN
A1
[2 marks]
A1
Note: Do not accept an answer of .
[1 mark]
METHOD 1
no earthquakes in the first years (M1)
EITHER
let be the number of earthquakes of at least magnitude in a year
(M1)
OR
let be the number of earthquakes in years
(M1)
THEN
A1
METHOD 2
no earthquakes in the first years (M1)
let be the number of earthquakes in years
since is large and is small
(M1)
A1
[3 marks]
Examiners report
Parts (a), (b), and (c) were accessible to many candidates who earned full marks with the manipulation of logs and indices presenting no problems. Part (d), however, proved to be too difficult for most and very few correct attempts were seen. As in question 9, most candidates relied on calculator notation when using the Poisson distribution. The discipline of defining a random variable in terms of its distribution and parameters helps to conceptualize the problem in terms that aid a better understanding. Most candidates who attempted this question blindly entered values into the Poisson distribution calculator and were unable to earn any marks. There were a couple of correct solutions using a binomial distribution to approximate the given quantity.
The rate, , of a chemical reaction at a fixed temperature is related to the concentration of two compounds, and , by the equation
, where , , .
A scientist measures the three variables three times during the reaction and obtains the following values.

Find , and .
Markscheme
(M1)
M1A1
Note: Allow any consistent base, allow numerical equivalents.
attempting to solve their system of equations (M1)
= 1.53, = 0.505 A1
= 0.997 A1
[6 marks]
Examiners report
The function is defined by , for .
The function is defined by
Find the inverse function , stating its domain.
Express in the form where A, B are constants.
Sketch the graph of . State the equations of any asymptotes and the coordinates of any intercepts with the axes.
The function is defined by , for ≥ 0.
State the domain and range of .
Markscheme
* This question is from an exam for a previous syllabus, and may contain minor differences in marking or structure.
attempt to make the subject of M1
A1
A1
A1
Note: Do not allow in place of .
A1
Note: The final A mark is independent.
[5 marks]
A1A1
[2 marks]

hyperbola shape, with single curves in second and fourth quadrants and third quadrant blank, including vertical asymptote A1
horizontal asymptote A1
intercepts A1
[3 marks]
the domain of is A1A1
the range of is A1A1
[4 marks]
Examiners report
The following table shows the time, in days, from December and the percentage of Christmas trees in stock at a shop on the beginning of that day.

The following table shows the natural logarithm of both and on these days to decimal places.

Use the data in the second table to find the value of and the value of for the regression line, .
Assuming that the model found in part (a) remains valid, estimate the percentage of trees in stock when .
Markscheme
A1A1
[2 marks]
M1
(A1)
A1
[3 marks]
Examiners report
Those candidates who did this question were often successful. There were a number, however, who found an equation of a line through two of the points instead of using their technology to find the equation of the regression line. A common problem was to introduce rounding errors at various stages throughout the problem. Some candidates failed to find the value of from that of .
Those candidates who did this question were often successful. There were a number, however, who found an equation of a line through two of the points instead of using their technology to find the equation of the regression line. A common problem was to introduce rounding errors at various stages throughout the problem. Some candidates failed to find the value of from that of .
The function is defined by .
Write down the range of .
Find an expression for .
Write down the domain and range of .
Markscheme
* This question is from an exam for a previous syllabus, and may contain minor differences in marking or structure.
A1A1
Note: A1 for correct end points, A1 for correct inequalities.
[2 marks]
(M1)A1
[2 marks]
A1A1
[2 marks]
Examiners report
Consider the function .
Express in the form .
Factorize .
Sketch the graph of , indicating on it the equations of the asymptotes, the coordinates of the -intercept and the local maximum.
Show that .
Hence find the value of if .
Sketch the graph of .
Determine the area of the region enclosed between the graph of , the -axis and the lines with equations and .
Markscheme
A1
[1 mark]
A1
[1 mark]

A1 for the shape
A1 for the equation
A1 for asymptotes and
A1 for coordinates
A1 -intercept
[5 marks]
M1
AG
[1 mark]
A1
M1
M1A1
[4 marks]
symmetry about the -axis M1
correct shape A1
Note: Allow FT from part (b).
[2 marks]
(M1)(A1)
A1
Note: Do not award FT from part (e).
[3 marks]
Examiners report
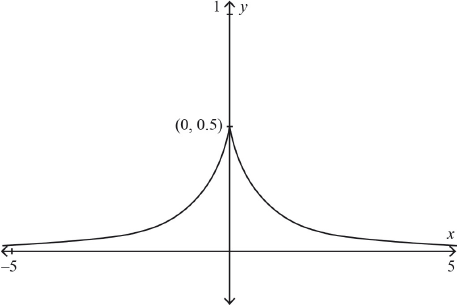
The graph of , 0 ≤ ≤ 5 is shown in the following diagram. The curve intercepts the -axis at (1, 0) and (4, 0) and has a local minimum at (3, −1).

The shaded area enclosed by the curve , the -axis and the -axis is 0.5. Given that ,
The area enclosed by the curve and the -axis between and is 2.5 .
Write down the -coordinate of the point of inflexion on the graph of .
find the value of .
find the value of .
Sketch the curve , 0 ≤ ≤ 5 indicating clearly the coordinates of the maximum and minimum points and any intercepts with the coordinate axes.
Markscheme
* This question is from an exam for a previous syllabus, and may contain minor differences in marking or structure.
3 A1
[1 mark]
attempt to use definite integral of (M1)
(A1)
= 3.5 A1
[3 marks]
(A1)
Note: (A1) is for −2.5.
= 1 A1
[2 marks]
 A1A1A1
A1 for correct shape over approximately the correct domain
A1 for maximum and minimum (coordinates or horizontal lines from 3.5 and 1 are required),
A1 for -intercept at 3
[3 marks]
Examiners report
Roger buys a new laptop for himself at a cost of . At the same time, he buys his daughter Chloe a higher specification laptop at a cost of .
It is anticipated that Roger’s laptop will depreciate at a rate of per year, whereas Chloe’s laptop will depreciate at a rate of per year.
Roger and Chloe’s laptops will have the same value years after they were purchased.
Estimate the value of Roger’s laptop after years.
Find the value of .
Comment on the validity of your answer to part (b).
Markscheme
(M1)A1
[2 marks]
(M1)
A1
Note: Award M1A0 for in place of .
[2 marks]
depreciation rates unlikely to be constant (especially over a long time period) R1
Note: Accept reasonable answers based on the magnitude of or the fact that “value” depends on factors other than time.
[1 mark]
Examiners report
Consider the function , where .
For , sketch the graph of . Indicate clearly the maximum and minimum values of the function.
Write down the least value of such that has an inverse.
For the value of found in part (b), write down the domain of .
For the value of found in part (b), find an expression for .
Markscheme
* This question is from an exam for a previous syllabus, and may contain minor differences in marking or structure.

concave down and symmetrical over correct domain A1
indication of maximum and minimum values of the function (correct range) A1A1
[3 marks]
= 0 A1
Note: Award A1 for = 0 only if consistent with their graph.
[1 mark]
A1
Note: Allow FT from their graph.
[1 mark]
(M1)
A1
[2 marks]
Examiners report
The function is defined for .
Find an expression for . You are not required to state a domain.
Solve .
Markscheme
an attempt to isolate (or if switched) (M1)
switching and (seen anywhere) M1
A1
[3 marks]
sketch of and (M1)
A1
[2 marks]
Examiners report
This question was well answered by most candidates.
It is believed that the power of a signal at a point km from an antenna is inversely proportional to where .
The value of is recorded at distances of to and the values of and are plotted on the graph below.

The values of and are shown in the table below.

Explain why this graph indicates that is inversely proportional to .
Find the equation of the least squares regression line of against .
Use your answer to part (b) to write down the value of to the nearest integer.
Find an expression for in terms of .
Markscheme
* This sample question was produced by experienced DP mathematics senior examiners to aid teachers in preparing for external assessment in the new MAA course. There may be minor differences in formatting compared to formal exam papers.
a straight line with a negative gradient A1A1
[2 marks]
A1A1
Note: A1 for each correct term.
[2 marks]
A1
[1 mark]
(M1)
A1
[2 marks]
Examiners report
The function is defined by where .
Find the remainder when is divided by .
Find the remainder when is divided by .
Prove that has only one real zero.
Write down the transformation that will transform the graph of onto the graph of .
The random variable follows a Poisson distribution with a mean of and .
Find the value of .
Markscheme
(M1)
Note: Award M1 for a valid attempt at remainder theorem or polynomial division.
= −12 A1
remainder = −12
[2 marks]
= 0 A1
remainder = 0
[1 mark]
(is a zero) A1
Note: Can be seen anywhere.
EITHER
factorise to get (M1)A1
(for ) (or equivalent statement) R1
Note: Award R1 if correct two complex roots are given.
OR
A1
attempting to show M1
eg discriminant = 36 – 96 < 0, completing the square
no turning points R1
THEN
only one real zero (as the curve is continuous) AG
[4 marks]
new graph is (M1)
stretch parallel to the -axis (with invariant), scale factor 0.5 A1
Note: Accept “horizontal” instead of “parallel to the -axis”.
[2 marks]
M1A1
Note: Allow factorials in the denominator for A1.
A1
Note: Accept any correct cubic equation without factorials and .
EITHER
(M1)
(A1)
OR
(M1)(A1)
THEN
= 1.5 A1
[6 marks]
Examiners report
It is believed that two variables, and are related. Experimental values of and are obtained. A graph of against shows a straight line passing through (2.1, 7.3) and (5.6, 2.4).
Hence, find
Find the equation of the straight line, giving your answer in the form , where .
a formula for in terms of .
the value of when .
Markscheme
gradient = −1.4 A1
M1
A1
[3 marks]
A1
[1 mark]
28000 A1
[1 mark]
Examiners report
A function is defined by for .
Find the range of .
Find an expression for the inverse function. The domain is not required.
Write down the range of .
Markscheme
and (A1)
range is A1A1
Note: Award at most A1A1A0 if strict inequalities are used.
[3 marks]
interchanging at any stage (A1)
(A1)
A1
[3 marks]
range is A1
[1 mark]
Examiners report
Consider the functions and defined by , \ , and , \ , where , .
The graphs of and intersect at the point P .
Describe the transformation by which is transformed to .
State the range of .
Sketch the graphs of and on the same axes, clearly stating the points of intersection with any axes.
Find the coordinates of P.
The tangent to at P passes through the origin (0, 0).
Determine the value of .
Markscheme
* This question is from an exam for a previous syllabus, and may contain minor differences in marking or structure.
translation units to the left (or equivalent) A1
[1 mark]
range is A1
[1 mark]

correct shape of A1
their translated units to left (possibly shown by marked on -axis) A1
asymptote included and marked as A1
intersects -axis at , A1
intersects -axis at , A1
intersects -axis at A1
Note: Do not penalise candidates if their graphs “cross” as .
Note: Do not award FT marks from the candidate’s part (a) to part (c).
[6 marks]
at P
attempt to solve (or equivalent) (M1)
(or ) A1
P (or P)
[2 marks]
attempt to differentiate or (M1)
A1
at P, A1
recognition that tangent passes through origin (M1)
A1
(A1)
A1
Note: For candidates who explicitly differentiate (rather than or , award M0A0A1M1A1A1A1.
[7 marks]
Examiners report
The graph of the function is translated by so that it then passes through the points and .
Find the value of and the value of .
Markscheme
new function is (M1)
A1
A1
(M1)
A1
(M1)A1
[7 marks]
Examiners report
Adesh wants to model the cooling of a metal rod. He heats the rod and records its temperature as it cools.

He believes the temperature can be modeled by , where .
Hence
Show that .
Find the equation of the regression line of on .
find the value of and of .
predict the temperature of the metal rod after 3 minutes.
Markscheme
M1
A1
AG
[2 marks]
M1A1A1
[3 marks]
A1
M1A1
[3 marks]
M1A1
[2 marks]
Examiners report
Consider the function , .
The graph of is translated two units to the left to form the function .
Express in the form where , , , , .
Markscheme
* This question is from an exam for a previous syllabus, and may contain minor differences in marking or structure.
M1
attempt to expand M1
(A1)
A1
A1
Note: For correct expansion of award max M0M1(A1)A0A1.
[5 marks]
Examiners report
Sketch the graph of , showing clearly any asymptotes and stating the coordinates of any points of intersection with the axes.
Hence or otherwise, solve the inequality .
Markscheme
* This question is from an exam for a previous syllabus, and may contain minor differences in marking or structure.

correct vertical asymptote A1
shape including correct horizontal asymptote A1
A1
A1
Note: Accept and marked on the axes.
[4 marks]
METHOD 1
(M1)
A1
(M1)
Note: Award this M1 for the line above or a correct sketch identifying a second critical value.
A1
solution is A1
METHOD 2
(M1)A1
A1
(M1)
solution is A1
METHOD 3
consider (M1)
Note: Also allow consideration of “>” or “=” for the awarding of the M mark.
recognition of critical value at A1
consider (M1)
Note: Also allow consideration of “>” or “=” for the awarding of the M mark.
recognition of critical value at A1
solution is A1
[5 marks]
Examiners report
Consider the graphs of and , where .
Sketch the graphs on the same set of axes.
Given that the graphs enclose a region of area 18 square units, find the value of b.
Markscheme
* This question is from an exam for a previous syllabus, and may contain minor differences in marking or structure.

graphs sketched correctly (condone missing b) A1A1
[2 marks]
(M1)A1
A1
[3 marks]
Examiners report
Let .
The graph of has a local maximum at A. Find the coordinates of A.
Show that there is exactly one point of inflexion, B, on the graph of .
The coordinates of B can be expressed in the form B where a, b. Find the value of a and the value of b.
Sketch the graph of showing clearly the position of the points A and B.
Markscheme
* This question is from an exam for a previous syllabus, and may contain minor differences in marking or structure.
attempt to differentiate (M1)
A1
Note: Award M1 for using quotient or product rule award A1 if correct derivative seen even in unsimplified form, for example .
M1
A1
A1
[5 marks]
M1
A1
Note: Award A1 for correct derivative seen even if not simplified.
A1
hence (at most) one point of inflexion R1
Note: This mark is independent of the two A1 marks above. If they have shown or stated their equation has only one solution this mark can be awarded.
changes sign at R1
so exactly one point of inflexion
[5 marks]
A1
(M1)A1
Note: Award M1 for the substitution of their value for into .
[3 marks]
 A1A1A1A1
A1 for shape for x < 0
A1 for shape for x > 0
A1 for maximum at A
A1 for POI at B.
Note: Only award last two A1s if A and B are placed in the correct quadrants, allowing for follow through.
[4 marks]
Examiners report
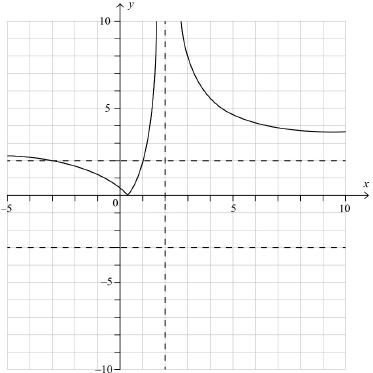
A rational function is defined by where the parameters and . The following diagram represents the graph of .

Using the information on the graph,
state the value of and the value of ;
find the value of .
Markscheme
* This question is from an exam for a previous syllabus, and may contain minor differences in marking or structure.
A1
A1
[2 marks]
use the coordinates of on the graph M1
A1
[2 marks]
Examiners report
Sketch the graphs of and on the following axes.

Solve the equation .
Markscheme
* This question is from an exam for a previous syllabus, and may contain minor differences in marking or structure.

straight line graph with correct axis intercepts A1
modulus graph: V shape in upper half plane A1
modulus graph having correct vertex and y-intercept A1
[3 marks]
METHOD 1
attempt to solve (M1)
A1
Note: Accept using the graph.
attempt to solve (algebraically) M1
A1
[4 marks]
METHOD 2
M1
attempt to factorise (or equivalent) M1
A1
A1
[4 marks]
Examiners report
A function is of the form . Part of the graph of is shown.

The points and have coordinates and , and lie on .
The point is a local maximum and the point is a local minimum.
Find the value of , of and of .
Markscheme
substitute coordinates of
(A1)
substitute coordinates of
EITHER
(M1)
minimum occurs when
(A1)
OR
minimum value occurs when (M1)
(A1)
OR
period (A1)
(M1)
THEN
A1
(A1)
eliminate or (M1)
OR
A1
A1
[8 marks]
Examiners report
This was a challenging question and suitably positioned at the end of the examination. Candidates who attempted it were normally able to substitute points A and B into the given equation. Some were able to determine the first derivative. Only a few candidates were able to earn significant marks for this question.
It is believed that two variables, and are related by the equation , where . Experimental values of and are obtained. A graph of against shows a straight line passing through (−1.7, 4.3) and (7.1, 17.5).
Find the value of and of .
Markscheme
M1A1
gradient M1
A1
-intercept M1
M1A1
[7 marks]
Examiners report
Let .
Part of the graph of is shown below. Point is a local maximum and has coordinates and point is a local minimum with coordinates .

Write down a sequence of transformations that will transform the graph of onto the graph of .
Markscheme
Vertical stretch, scale factor A1
Horizontal stretch, scale factor A1
Horizontal translation of unit to the right A1
Note: The vertical stretch can be at any position in the order of transformations. If the order of the final two transformations are reversed the horizontal translation is units to the right.
[3 marks]