
SL Paper 2
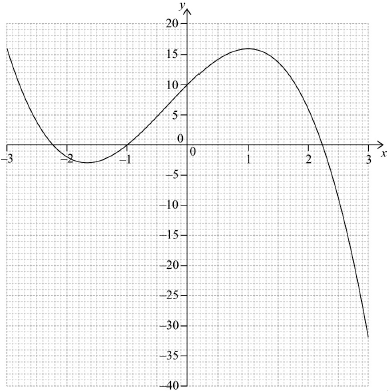
Consider the function .
Sketch the graph of y = f (x), for −4 ≤ x ≤ 3 and −50 ≤ y ≤ 100.
Use your graphic display calculator to find the zero of f (x).
Use your graphic display calculator to find the coordinates of the local minimum point.
Use your graphic display calculator to find the equation of the tangent to the graph of y = f (x) at the point (–2, 38.75).
Give your answer in the form y = mx + c.
Markscheme
* This question is from an exam for a previous syllabus, and may contain minor differences in marking or structure.
 (A1)(A1)(A1)(A1)
Note: Award (A1) for axis labels and some indication of scale; accept y or f(x).
Use of graph paper is not required. If no scale is given, assume the given window for zero and minimum point.
Award (A1) for smooth curve with correct general shape.
Award (A1) for x-intercept closer to y-axis than to end of sketch.
Award (A1) for correct local minimum with x-coordinate closer to y-axis than end of sketch and y-coordinate less than half way to top of sketch.
Award at most (A1)(A0)(A1)(A1) if the sketch intersects the y-axis or if the sketch curves away from the y-axis as x approaches zero.
[4 marks]
1.19 (1.19055…) (A1)
Note: Accept an answer of (1.19, 0).
Do not follow through from an incorrect sketch.
[1 mark]
(−1.5, 36) (A1)(A1)
Note: Award (A0)(A1) if parentheses are omitted.
Accept x = −1.5, y = 36.
[2 marks]
y = −9.25x + 20.3 (y = −9.25x + 20.25) (A1)(A1)
Note: Award (A1) for −9.25x, award (A1) for +20.25, award a maximum of (A0)(A1) if answer is not an equation.
[2 marks]
Examiners report
A water container is made in the shape of a cylinder with internal height cm and internal base radius cm.
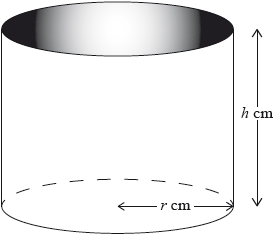
The water container has no top. The inner surfaces of the container are to be coated with a water-resistant material.
The volume of the water container is .
The water container is designed so that the area to be coated is minimized.
One can of water-resistant material coats a surface area of .
Write down a formula for , the surface area to be coated.
Express this volume in .
Write down, in terms of and , an equation for the volume of this water container.
Show that .
Find .
Using your answer to part (e), find the value of which minimizes .
Find the value of this minimum area.
Find the least number of cans of water-resistant material that will coat the area in part (g).
Markscheme
* This question is from an exam for a previous syllabus, and may contain minor differences in marking or structure.
(A1)(A1)
Note: Award (A1) for either OR seen. Award (A1) for two correct terms added together.
[2 marks]
(A1)
Notes: Units not required.
[1 mark]
(A1)(ft)
Notes: Award (A1)(ft) for equating to their part (b).
Do not accept unless is explicitly defined as their part (b).
[1 mark]
(A1)(ft)(M1)
Note: Award (A1)(ft) for their seen.
Award (M1) for correctly substituting only into a correct part (a).
Award (A1)(ft)(M1) for rearranging part (c) to and substituting for in expression for .
(AG)
Notes: The conclusion, , must be consistent with their working seen for the (A1) to be awarded.
Accept as equivalent to .
[2 marks]
(A1)(A1)(A1)
Note: Award (A1) for , (A1) for or , (A1) for .
[3 marks]
(M1)
Note: Award (M1) for equating their part (e) to zero.
OR (M1)
Note: Award (M1) for isolating .
OR
sketch of derivative function (M1)
with its zero indicated (M1)
(A1)(ft)(G2)
[3 marks]
(M1)
Note: Award (M1) for correct substitution of their part (f) into the given equation.
(A1)(ft)(G2)
[2 marks]
(M1)
Note: Award (M1) for dividing their part (g) by 2000.
(A1)(ft)
Notes: Follow through from part (g).
14 (cans) (A1)(ft)(G3)
Notes: Final (A1) awarded for rounding up their to the next integer.
[3 marks]
Examiners report
Let and , for .
Find .
Solve the equation .
Hence or otherwise, given that , find the value of .
Markscheme
* This question is from an exam for a previous syllabus, and may contain minor differences in marking or structure.
attempt to form composite (in any order) (M1)
eg
A1 N2
[2 marks]
valid approach using GDC (M1)
eg  ,
,
A1 N2
[2 marks]
METHOD 1 – (using properties of functions)
recognizing inverse relationship (M1)
eg
equating to their from (i) (A1)
eg
A1 N2
METHOD 2 – (finding inverse)
interchanging and (seen anywhere) (M1)
eg
correct working (A1)
eg , sketch showing intersection of and
A1 N2
[3 marks]
Examiners report
The cross-sectional view of a tunnel is shown on the axes below. The line represents a vertical wall located at the left side of the tunnel. The height, in metres, of the tunnel above the horizontal ground is modelled by , relative to an origin .

Point has coordinates , point has coordinates , and point has coordinates .
When the height of the tunnel is and when the height of the tunnel is . These points are shown as and on the diagram, respectively.
Find .
Hence find the maximum height of the tunnel.
Use the trapezoidal rule, with three intervals, to estimate the cross-sectional area of the tunnel.
Write down the integral which can be used to find the cross-sectional area of the tunnel.
Hence find the cross-sectional area of the tunnel.
Markscheme
evidence of power rule (at least one correct term seen) (M1)
A1
[2 marks]
M1
A1
(M1)
Note: Award M1 for substituting their zero for into .
A1
Note: Award M0A0M0A0 for an unsupported .
Award at most M0A0M1A0 if only the last two lines in the solution are seen.
Award at most M1A0M1A1 if their is not seen.
[6 marks]
(A1)(M1)
Note: Award A1 for seen. Award M1 for correct substitution into the trapezoidal rule (the zero can be omitted in working).
A1
[3 marks]
OR A1A1
Note: Award A1 for a correct integral, A1 for correct limits in the correct location. Award at most A0A1 if is omitted.
[2 marks]
A2
Note: As per the marking instructions, FT from their integral in part (c)(i). Award at most A1FTA0 if their area is , this is outside the constraints of the question (a rectangle).
[2 marks]
Examiners report
Urvashi wants to model the height of a moving object. She collects the following data showing the height, metres, of the object at time seconds.

She believes the height can be modeled by a quadratic function, , where .
Hence find
Show that .
Write down two more equations for , and .
Solve this system of three equations to find the value of , and .
when the height of the object is zero.
the maximum height of the object.
Markscheme
M1
AG
[1 mark]
attempt to substitute either (5, 38) or (7, 24) M1
A1
A1
[3 marks]
M1A1A1A1
[3 marks]
M1
seconds M1A1
[3 marks]
attempt to find maximum height, e.g. sketch of graph M1
metres A1
[2 marks]
Examiners report
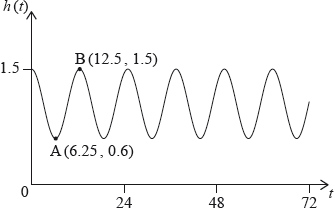
A wind turbine is designed so that the rotation of the blades generates electricity. The turbine is built on horizontal ground and is made up of a vertical tower and three blades.
The point is on the base of the tower directly below point at the top of the tower. The height of the tower, , is . The blades of the turbine are centred at and are each of length . This is shown in the following diagram.

The end of one of the blades of the turbine is represented by point on the diagram. Let be the height of above the ground, measured in metres, where varies as the blade rotates.
Find the
The blades of the turbine complete rotations per minute under normal conditions, moving at a constant rate.
The height, , of point can be modelled by the following function. Time, , is measured from the instant when the blade first passes and is measured in seconds.
Looking through his window, Tim has a partial view of the rotating wind turbine. The position of his window means that he cannot see any part of the wind turbine that is more than above the ground. This is illustrated in the following diagram.

maximum value of .
minimum value of .
Find the time, in seconds, it takes for the blade to make one complete rotation under these conditions.
Calculate the angle, in degrees, that the blade turns through in one second.
Write down the amplitude of the function.
Find the period of the function.
Sketch the function for , clearly labelling the coordinates of the maximum and minimum points.
Find the height of above the ground when .
Find the time, in seconds, that point is above a height of , during each complete rotation.
At any given instant, find the probability that point is visible from Tim’s window.
The wind speed increases. The blades rotate at twice the speed, but still at a constant rate.
At any given instant, find the probability that Tim can see point from his window. Justify your answer.
Markscheme
maximum metres A1
[1 mark]
minimum metres A1
[1 mark]
A1
[1 mark]
(M1)
Note: Award (M1) for divided by their time for one revolution.
A1
[2 marks]
(amplitude =) A1
[1 mark]
(period ) A1
[1 mark]

Maximum point labelled with correct coordinates. A1
At least one minimum point labelled. Coordinates seen for any minimum points must be correct. A1
Correct shape with an attempt at symmetry and “concave up" evident as it approaches the minimum points. Graph must be drawn in the given domain. A1
[3 marks]
(M1)
A1
[2 marks]
evidence of on graph OR (M1)
coordinates OR or equivalent (A1)
Note: Award A1 for either -coordinate seen.
seconds A1
[3 marks]
(M1)
(M1)
A1
[3 marks]
METHOD 1
changing the frequency/dilation of the graph will not change the proportion of time that point is visible. A1
A1
METHOD 2
correct calculation of relevant found values
A1
A1
Note: Award A0A1 for an unsupported correct probability.
[2 marks]
Examiners report
Judging by the responses in parts (a), (b) and (c), transferring and interpreting the information from a diagram is a skill that requires further nurturing. The amplitude should be expressed as a positive value. Overall, the sketch of reflected the correct general shape. Common flaws included a lack of symmetry about the mean, 'concave up' not evident as the curve approached the minimum points, and the curve being drawn beyond the given domain. At least one correct pair of coordinates was seen, though some gave their answers inaccurately, suggesting they found an approximate solution using the "trace" feature in their GDC. Most were able to find the height of point when and make an attempt to find a time at which point is at a height of . It was pleasing to see a number of candidates draw on their sketch, which would no doubt have assisted the candidates in visualizing the solution. Part (f) proved to be a high-grade discriminator, with few attaining full marks. Premature rounding in part (f)(i) resulted in an inaccurate final answer. It is recommended that candidates retrieve and use unrounded values from previous calculations in their GDC. Though many recognized the probability was independent of the speed of rotation, most were not able to support their answer through a correct calculation or written explanation.
Judging by the responses in parts (a), (b) and (c), transferring and interpreting the information from a diagram is a skill that requires further nurturing. The amplitude should be expressed as a positive value. Overall, the sketch of reflected the correct general shape. Common flaws included a lack of symmetry about the mean, 'concave up' not evident as the curve approached the minimum points, and the curve being drawn beyond the given domain. At least one correct pair of coordinates was seen, though some gave their answers inaccurately, suggesting they found an approximate solution using the "trace" feature in their GDC. Most were able to find the height of point when and make an attempt to find a time at which point is at a height of . It was pleasing to see a number of candidates draw on their sketch, which would no doubt have assisted the candidates in visualizing the solution. Part (f) proved to be a high-grade discriminator, with few attaining full marks. Premature rounding in part (f)(i) resulted in an inaccurate final answer. It is recommended that candidates retrieve and use unrounded values from previous calculations in their GDC. Though many recognized the probability was independent of the speed of rotation, most were not able to support their answer through a correct calculation or written explanation.
Judging by the responses in parts (a), (b) and (c), transferring and interpreting the information from a diagram is a skill that requires further nurturing. The amplitude should be expressed as a positive value. Overall, the sketch of reflected the correct general shape. Common flaws included a lack of symmetry about the mean, 'concave up' not evident as the curve approached the minimum points, and the curve being drawn beyond the given domain. At least one correct pair of coordinates was seen, though some gave their answers inaccurately, suggesting they found an approximate solution using the "trace" feature in their GDC. Most were able to find the height of point when and make an attempt to find a time at which point is at a height of . It was pleasing to see a number of candidates draw on their sketch, which would no doubt have assisted the candidates in visualizing the solution. Part (f) proved to be a high-grade discriminator, with few attaining full marks. Premature rounding in part (f)(i) resulted in an inaccurate final answer. It is recommended that candidates retrieve and use unrounded values from previous calculations in their GDC. Though many recognized the probability was independent of the speed of rotation, most were not able to support their answer through a correct calculation or written explanation.
Judging by the responses in parts (a), (b) and (c), transferring and interpreting the information from a diagram is a skill that requires further nurturing. The amplitude should be expressed as a positive value. Overall, the sketch of reflected the correct general shape. Common flaws included a lack of symmetry about the mean, 'concave up' not evident as the curve approached the minimum points, and the curve being drawn beyond the given domain. At least one correct pair of coordinates was seen, though some gave their answers inaccurately, suggesting they found an approximate solution using the "trace" feature in their GDC. Most were able to find the height of point when and make an attempt to find a time at which point is at a height of . It was pleasing to see a number of candidates draw on their sketch, which would no doubt have assisted the candidates in visualizing the solution. Part (f) proved to be a high-grade discriminator, with few attaining full marks. Premature rounding in part (f)(i) resulted in an inaccurate final answer. It is recommended that candidates retrieve and use unrounded values from previous calculations in their GDC. Though many recognized the probability was independent of the speed of rotation, most were not able to support their answer through a correct calculation or written explanation.
Judging by the responses in parts (a), (b) and (c), transferring and interpreting the information from a diagram is a skill that requires further nurturing. The amplitude should be expressed as a positive value. Overall, the sketch of reflected the correct general shape. Common flaws included a lack of symmetry about the mean, 'concave up' not evident as the curve approached the minimum points, and the curve being drawn beyond the given domain. At least one correct pair of coordinates was seen, though some gave their answers inaccurately, suggesting they found an approximate solution using the "trace" feature in their GDC. Most were able to find the height of point when and make an attempt to find a time at which point is at a height of . It was pleasing to see a number of candidates draw on their sketch, which would no doubt have assisted the candidates in visualizing the solution. Part (f) proved to be a high-grade discriminator, with few attaining full marks. Premature rounding in part (f)(i) resulted in an inaccurate final answer. It is recommended that candidates retrieve and use unrounded values from previous calculations in their GDC. Though many recognized the probability was independent of the speed of rotation, most were not able to support their answer through a correct calculation or written explanation.
Judging by the responses in parts (a), (b) and (c), transferring and interpreting the information from a diagram is a skill that requires further nurturing. The amplitude should be expressed as a positive value. Overall, the sketch of reflected the correct general shape. Common flaws included a lack of symmetry about the mean, 'concave up' not evident as the curve approached the minimum points, and the curve being drawn beyond the given domain. At least one correct pair of coordinates was seen, though some gave their answers inaccurately, suggesting they found an approximate solution using the "trace" feature in their GDC. Most were able to find the height of point when and make an attempt to find a time at which point is at a height of . It was pleasing to see a number of candidates draw on their sketch, which would no doubt have assisted the candidates in visualizing the solution. Part (f) proved to be a high-grade discriminator, with few attaining full marks. Premature rounding in part (f)(i) resulted in an inaccurate final answer. It is recommended that candidates retrieve and use unrounded values from previous calculations in their GDC. Though many recognized the probability was independent of the speed of rotation, most were not able to support their answer through a correct calculation or written explanation.
Judging by the responses in parts (a), (b) and (c), transferring and interpreting the information from a diagram is a skill that requires further nurturing. The amplitude should be expressed as a positive value. Overall, the sketch of reflected the correct general shape. Common flaws included a lack of symmetry about the mean, 'concave up' not evident as the curve approached the minimum points, and the curve being drawn beyond the given domain. At least one correct pair of coordinates was seen, though some gave their answers inaccurately, suggesting they found an approximate solution using the "trace" feature in their GDC. Most were able to find the height of point when and make an attempt to find a time at which point is at a height of . It was pleasing to see a number of candidates draw on their sketch, which would no doubt have assisted the candidates in visualizing the solution. Part (f) proved to be a high-grade discriminator, with few attaining full marks. Premature rounding in part (f)(i) resulted in an inaccurate final answer. It is recommended that candidates retrieve and use unrounded values from previous calculations in their GDC. Though many recognized the probability was independent of the speed of rotation, most were not able to support their answer through a correct calculation or written explanation.
Judging by the responses in parts (a), (b) and (c), transferring and interpreting the information from a diagram is a skill that requires further nurturing. The amplitude should be expressed as a positive value. Overall, the sketch of reflected the correct general shape. Common flaws included a lack of symmetry about the mean, 'concave up' not evident as the curve approached the minimum points, and the curve being drawn beyond the given domain. At least one correct pair of coordinates was seen, though some gave their answers inaccurately, suggesting they found an approximate solution using the "trace" feature in their GDC. Most were able to find the height of point when and make an attempt to find a time at which point is at a height of . It was pleasing to see a number of candidates draw on their sketch, which would no doubt have assisted the candidates in visualizing the solution. Part (f) proved to be a high-grade discriminator, with few attaining full marks. Premature rounding in part (f)(i) resulted in an inaccurate final answer. It is recommended that candidates retrieve and use unrounded values from previous calculations in their GDC. Though many recognized the probability was independent of the speed of rotation, most were not able to support their answer through a correct calculation or written explanation.
Judging by the responses in parts (a), (b) and (c), transferring and interpreting the information from a diagram is a skill that requires further nurturing. The amplitude should be expressed as a positive value. Overall, the sketch of reflected the correct general shape. Common flaws included a lack of symmetry about the mean, 'concave up' not evident as the curve approached the minimum points, and the curve being drawn beyond the given domain. At least one correct pair of coordinates was seen, though some gave their answers inaccurately, suggesting they found an approximate solution using the "trace" feature in their GDC. Most were able to find the height of point when and make an attempt to find a time at which point is at a height of . It was pleasing to see a number of candidates draw on their sketch, which would no doubt have assisted the candidates in visualizing the solution. Part (f) proved to be a high-grade discriminator, with few attaining full marks. Premature rounding in part (f)(i) resulted in an inaccurate final answer. It is recommended that candidates retrieve and use unrounded values from previous calculations in their GDC. Though many recognized the probability was independent of the speed of rotation, most were not able to support their answer through a correct calculation or written explanation.
Judging by the responses in parts (a), (b) and (c), transferring and interpreting the information from a diagram is a skill that requires further nurturing. The amplitude should be expressed as a positive value. Overall, the sketch of reflected the correct general shape. Common flaws included a lack of symmetry about the mean, 'concave up' not evident as the curve approached the minimum points, and the curve being drawn beyond the given domain. At least one correct pair of coordinates was seen, though some gave their answers inaccurately, suggesting they found an approximate solution using the "trace" feature in their GDC. Most were able to find the height of point when and make an attempt to find a time at which point is at a height of . It was pleasing to see a number of candidates draw on their sketch, which would no doubt have assisted the candidates in visualizing the solution. Part (f) proved to be a high-grade discriminator, with few attaining full marks. Premature rounding in part (f)(i) resulted in an inaccurate final answer. It is recommended that candidates retrieve and use unrounded values from previous calculations in their GDC. Though many recognized the probability was independent of the speed of rotation, most were not able to support their answer through a correct calculation or written explanation.
Judging by the responses in parts (a), (b) and (c), transferring and interpreting the information from a diagram is a skill that requires further nurturing. The amplitude should be expressed as a positive value. Overall, the sketch of reflected the correct general shape. Common flaws included a lack of symmetry about the mean, 'concave up' not evident as the curve approached the minimum points, and the curve being drawn beyond the given domain. At least one correct pair of coordinates was seen, though some gave their answers inaccurately, suggesting they found an approximate solution using the "trace" feature in their GDC. Most were able to find the height of point when and make an attempt to find a time at which point is at a height of . It was pleasing to see a number of candidates draw on their sketch, which would no doubt have assisted the candidates in visualizing the solution. Part (f) proved to be a high-grade discriminator, with few attaining full marks. Premature rounding in part (f)(i) resulted in an inaccurate final answer. It is recommended that candidates retrieve and use unrounded values from previous calculations in their GDC. Though many recognized the probability was independent of the speed of rotation, most were not able to support their answer through a correct calculation or written explanation.
The Texas Star is a Ferris wheel at the state fair in Dallas. The Ferris wheel has a diameter of . To begin the ride, a passenger gets into a chair at the lowest point on the wheel, which is above the ground, as shown in the following diagram. A ride consists of multiple revolutions, and the Ferris wheel makes revolutions per minute.

The height of a chair above the ground, , measured in metres, during a ride on the Ferris wheel can be modelled by the function , where is the time, in seconds, since a passenger began their ride.
Calculate the value of
A ride on the Ferris wheel lasts for minutes in total.
For exactly one ride on the Ferris wheel, suggest
Big Tex is a metre-tall cowboy statue that stands on the horizontal ground next to the Ferris wheel.

[Source: Aline Escobar., n.d. Cowboy. [image online] Available at: https://thenounproject.com/search/?q=cowboy&i=1080130
This file is licensed under the Creative Commons Attribution-ShareAlike 3.0 Unported (CC BY-SA 3.0)
https://creativecommons.org/licenses/by-sa/3.0/deed.en [Accessed 13/05/2021]. Source adapted.]
There is a plan to relocate the Texas Star Ferris wheel onto a taller platform which will increase the maximum height of the Ferris wheel to . This will change the value of one parameter, , or , found in part (a).
.
.
.
Calculate the number of revolutions of the Ferris wheel per ride.
an appropriate domain for .
an appropriate range for .
By considering the graph of , determine the length of time during one revolution of the Ferris wheel for which the chair is higher than the cowboy statue.
Identify which parameter will change.
Find the new value of the parameter identified in part (e)(i).
Markscheme
an attempt to find the amplitude (M1)
OR
A1
Note: Accept an answer of .
[2 marks]
(period ) (A1)
()
A1
Note: Accept an answer of .
[2 marks]
attempt to find (M1)
OR
A1
[2 marks]
OR (M1)
(revolutions per ride) A1
[2 marks]
A1
[1 mark]
A1A1
Note: Award A1 for correct endpoints of domain and A1 for correct endpoints of range. Award A1 for correct direction of both inequalities.
[2 marks]
graph of and OR (M1)
and (A1)
A1
[3 marks]
A1
[1 mark]
EITHER
(A1)
OR
(A1)
OR
(new platform height) (A1)
THEN
A1
[2 marks]
Examiners report
Overall, this question was not well answered. Part (a) proved to be problematic for most candidates – hardly any candidates determined all three parameters correctly. The value of b was rarely found. Most candidates were able to find the number of revolutions in part (b). Only a small number of candidates were able to determine the domain and range in part (c) correctly. In part (d), a number of candidates understood that they needed to solve the equation , and gained the method mark, but very few candidates gained all three marks. In part (e), determining the parameter which would change proved challenging, and few were able to determine correctly how the parameter d would change.
A function is given by .
The graph of the function intersects the graph of .
Find the exact value of each of the zeros of .
Expand the expression for .
Find .
Use your answer to part (b)(ii) to find the values of for which is increasing.
Draw the graph of for and . Use a scale of 2 cm to represent 1 unit on the -axis and 1 cm to represent 5 units on the -axis.
Write down the coordinates of the point of intersection.
Markscheme
* This question is from an exam for a previous syllabus, and may contain minor differences in marking or structure.
(A1)(A1)(A1)
Note: Award (A1) for –1 and each exact value seen. Award at most (A1)(A0)(A1) for use of 2.23606… instead of .
[3 marks]
(A1)
Notes: The expansion may be seen in part (b)(ii).
[1 mark]
(A1)(ft)(A1)(ft)(A1)(ft)
Notes: Follow through from part (b)(i). Award (A1)(ft) for each correct term. Award at most (A1)(ft)(A1)(ft)(A0) if extra terms are seen.
[3 marks]
(M1)
Notes: Award (M1) for their . Accept equality or weak inequality.
(A1)(ft)(A1)(ft)(G2)
Notes: Award (A1)(ft) for correct endpoints, (A1)(ft) for correct weak or strict inequalities. Follow through from part (b)(ii). Do not award any marks if there is no answer in part (b)(ii).
[3 marks]
 (A1)(A1)(ft)(A1)(ft)(A1)
Notes: Award (A1) for correct scale; axes labelled and drawn with a ruler.
Award (A1)(ft) for their correct -intercepts in approximately correct location.
Award (A1) for correct minimum and maximum points in approximately correct location.
Award (A1) for a smooth continuous curve with approximate correct shape. The curve should be in the given domain.
Follow through from part (a) for the -intercepts.
[4 marks]
(G1)(ft)(G1)(ft)
Notes: Award (G1) for 1.49 and (G1) for 13.9 written as a coordinate pair. Award at most (G0)(G1) if parentheses are missing. Accept and . Follow through from part (b)(i).
[2 marks]
Examiners report
A pan, in which to cook a pizza, is in the shape of a cylinder. The pan has a diameter of 35 cm and a height of 0.5 cm.

A chef had enough pizza dough to exactly fill the pan. The dough was in the shape of a sphere.
The pizza was cooked in a hot oven. Once taken out of the oven, the pizza was placed in a dining room.
The temperature, , of the pizza, in degrees Celsius, °C, can be modelled by
where is a constant and is the time, in minutes, since the pizza was taken out of the oven.
When the pizza was taken out of the oven its temperature was 230 °C.
The pizza can be eaten once its temperature drops to 45 °C.
Calculate the volume of this pan.
Find the radius of the sphere in cm, correct to one decimal place.
Find the value of .
Find the temperature that the pizza will be 5 minutes after it is taken out of the oven.
Calculate, to the nearest second, the time since the pizza was taken out of the oven until it can be eaten.
In the context of this model, state what the value of 19 represents.
Markscheme
* This question is from an exam for a previous syllabus, and may contain minor differences in marking or structure.
(A1)(M1)
Notes: Award (A1) for 17.5 (or equivalent) seen.
Award (M1) for correct substitutions into volume of a cylinder formula.
(A1)(G2)
[3 marks]
(M1)
Note: Award (M1) for equating their answer to part (a) to the volume of sphere.
(M1)
Note: Award (M1) for correctly rearranging so is the subject.
(A1)(ft)(G2)
Note: Award (A1) for correct unrounded answer seen. Follow through from part (a).
(A1)(ft)(G3)
Note: The final (A1)(ft) is awarded for rounding their unrounded answer to one decimal place.
[4 marks]
(M1)
Note: Award (M1) for correct substitution.
(A1)(G2)
[2 marks]
(M1)
Note: Award (M1) for correct substitution into the function, . Follow through from part (c). The negative sign in the exponent is required for correct substitution.
(°C) (°C)) (A1)(ft)(G2)
[2 marks]
(M1)
Note: Award (M1) for equating 45 to the exponential equation and for correct substitution (follow through for their in part (c)).
(A1)(ft)(G1)
(A1)(ft)(G2)
Note: Award final (A1)(ft) for converting their minutes into seconds.
[3 marks]
the temperature of the (dining) room (A1)
OR
the lowest final temperature to which the pizza will cool (A1)
[1 mark]
Examiners report
Consider the curve y = 2x3 − 9x2 + 12x + 2, for −1 < x < 3
Sketch the curve for −1 < x < 3 and −2 < y < 12.
A teacher asks her students to make some observations about the curve.
Three students responded.
Nadia said “The x-intercept of the curve is between −1 and zero”.
Rick said “The curve is decreasing when x < 1 ”.
Paula said “The gradient of the curve is less than zero between x = 1 and x = 2 ”.
State the name of the student who made an incorrect observation.
Find .
Given that y = 2x3 − 9x2 + 12x + 2 = k has three solutions, find the possible values of k.
Markscheme
* This question is from an exam for a previous syllabus, and may contain minor differences in marking or structure.
 (A1)(A1)(A1)(A1)
Note: Award (A1) for correct window (condone a window which is slightly off) and axes labels. An indication of window is necessary. −1 to 3 on the x-axis and −2 to 12 on the y-axis and a graph in that window.
(A1) for correct shape (curve having cubic shape and must be smooth).
(A1) for both stationary points in the 1st quadrant with approximate correct position,
(A1) for intercepts (negative x-intercept and positive y intercept) with approximate correct position.
[4 marks]
Rick (A1)
Note: Award (A0) if extra names stated.
[1 mark]
6x2 − 18x + 12 (A1)(A1)(A1)
Note: Award (A1) for each correct term. Award at most (A1)(A1)(A0) if extra terms seen.
[3 marks]
6 < k < 7 (A1)(A1)(ft)(A1)
Note: Award (A1) for an inequality with 6, award (A1)(ft) for an inequality with 7 from their part (c) provided it is greater than 6, (A1) for their correct strict inequalities. Accept ]6, 7[ or (6, 7).
[3 marks]
Examiners report
At Grande Anse Beach the height of the water in metres is modelled by the function , where is the number of hours after 21:00 hours on 10 December 2017. The following diagram shows the graph of , for .
The point represents the first low tide and represents the next high tide.
How much time is there between the first low tide and the next high tide?
Find the difference in height between low tide and high tide.
Find the value of ;
Find the value of ;
Find the value of .
There are two high tides on 12 December 2017. At what time does the second high tide occur?
Markscheme
attempt to find the difference of -values of A and B (M1)
eg
6.25 (hours), (6 hours 15 minutes) A1 N2
[2 marks]
attempt to find the difference of -values of A and B (M1)
eg
A1 N2
[2 marks]
valid approach (M1)
eg
A1 N2
[2 marks]
METHOD 1
period (seen anywhere) (A1)
valid approach (seen anywhere) (M1)
eg
0.502654
A1 N2
METHOD 2
attempt to use a coordinate to make an equation (M1)
eg
correct substitution (A1)
eg
0.502654
A1 N2
[3 marks]
valid method to find (M1)
eg
A1 N2
[2 marks]
METHOD 1
attempt to find start or end -values for 12 December (M1)
eg
finds -value for second max (A1)
23:00 (or 11 pm) A1 N3
METHOD 2
valid approach to list either the times of high tides after 21:00 or the -values of high tides after 21:00, showing at least two times (M1)
eg
correct time of first high tide on 12 December (A1)
eg10:30 (or 10:30 am)
time of second high tide = 23:00 A1 N3
METHOD 3
attempt to set their equal to 1.5 (M1)
eg
correct working to find second max (A1)
eg
23:00 (or 11 pm) A1 N3
[3 marks]
Examiners report
Let and , for .
Show that .
On the following grid, sketch the graph of , for .

The equation has exactly two solutions, for . Find the possible values of .
Markscheme
* This question is from an exam for a previous syllabus, and may contain minor differences in marking or structure.
attempt to form composite in either order (M1)
eg
A1
AG N0
[2 marks]
 A1
A1
A1A1 N3
Note: Award A1 for approximately correct shape which changes from concave down to concave up. Only if this A1 is awarded, award the following:
A1 for left hand endpoint in circle and right hand endpoint in oval,
A1 for minimum in oval.
[3 marks]
evidence of identifying max/min as relevant points (M1)
eg
correct interval (inclusion/exclusion of endpoints must be correct) A2 N3
eg
[3 marks]
Examiners report
Consider the function .
Consider a second function, .
Calculate .
Sketch the graph of for and .
Write down the equation of the vertical asymptote.
Write down the coordinates of the -intercept.
Write down the possible values of for which and .
Find the solution of .
Markscheme
* This question is from an exam for a previous syllabus, and may contain minor differences in marking or structure.
(M1)
Note: Award (M1) for correct substitution into function.
(A1)(G2)
[2 marks]
 (A1)(A1)(A1)(A1)
Note: Award (A1) for indication of correct window and labelled axes.
Award (A1) for correct shape and position for (with the local maximum, local minimum and -intercept in relative approximate location in quadrant).
Award (A1) for correct shape and position for (with the local minimum in relative approximate location in quadrant).
Award (A1) for smooth curve with indication of asymptote (graph should not touch -axis and should not curve away from the -axis). The asymptote is only assessed in this mark.
[4 marks]
(A2)
Note: Award (A1) for “” and (A1) for “”.
The answer must be an equation.
[2 marks]
(A1)(A1)
Note: Award (A1) for each correct coordinate. Award (A0)(A1) if parentheses are missing.
[2 marks]
(A1)(A1)
Note: Award (A1) for both correct end points, (A1) for strict inequalities used with 2 endpoints.
[2 marks]
(M1)
Note: Award (M1) for equating the expressions for and or for the line sketched (positive gradient, negative -intercept) on their graph from part (a).
(A1)(G2)
Note: Award a maximum of (M1)(A0) or (G1) for coordinate pair seen as final answer.
[2 marks]
Examiners report
Consider the function .
The tangent to the graph of at is parallel to the line .
Find .
Show that .
Find the equation of the tangent to the graph of at . Give your answer in the form .
Use your answer to part (a) and the value of , to find the -coordinates of the stationary points of the graph of .
Find .
Hence justify that is decreasing at .
Find the -coordinate of the local minimum.
Markscheme
* This question is from an exam for a previous syllabus, and may contain minor differences in marking or structure.
(A1)(A1)(A1)
Note: Award (A1) for , (A1) for and (A1) for . Award at most (A1)(A1)(A0) if additional terms are seen.
[3 marks]
(M1)(M1)
Note: Award (M1) for equating their derivative to 21. Award (M1) for substituting 2 into their derivative. The second (M1) should only be awarded if correct working leads to the final answer of .
Substituting in the known value, , invalidates the process; award (M0)(M0).
(AG)
[2 marks]
(M1)
Note: Award (M1) for substituting 2 into .
(M1)
Note: Award (M1) for correct substitution of 21, 2 and their 7 into gradient intercept form.
OR
(M1)
Note: Award (M1) for correct substitution of 21, 2 and their 7 into gradient point form.
(A1) (G2)
[3 marks]
(or equivalent) (M1)
Note: Award (M1) for equating their part (a) (with substituted) to zero.
(A1)(ft)(A1)(ft)
Note: Follow through from part (a).
[3 marks]
(M1)
Note: Award (M1) for substituting into their derivative, with substituted. Follow through from part (a).
(A1)(ft) (G2)
[2 marks]
(therefore is decreasing when ) (R1)
[1 marks]
(M1)
Note: Award (M1) for correctly substituting 6 and their 1 into .
(A1)(ft) (G2)
Note: Award, at most, (M1)(A0) or (G1) if answer is given as a coordinate pair. Follow through from part (c).
[2 marks]
Examiners report
The diagram shows the straight line . Points , and are points on .

is the midpoint of .
Line is perpendicular to and passes through point .
The point is on .
Find the gradient of .
Find the coordinates of point .
Find the equation of . Give your answer in the form , where .
Find the value of .
Find the distance between points and .
Given that the length of is , find the area of triangle .
Markscheme
(M1)
Note: Award (M1) for correct substitution into the gradient formula.
(A1)(G2)
[2 marks]
and (M1)
Note: Award (M1) for correct substitution into the midpoint formula for both coordinates.
OR
 (M1)
(M1)
Note: Award (M1) for a sketch showing the horizontal displacement from to is and the vertical displacement is and the coordinates at .
OR
and (M1)
Note: Award (M1) for correct equations seen.
(A1)(G1)(G1)
Note: Accept . Award at most (M1)(A0) or (G1)(G0) if parentheses are missing.
[2 marks]
gradient of the normal (A1)(ft)
Note: Follow through from their gradient from part (a).
OR (M1)
Note: Award (M1) for correct substitution of and their gradient of normal into straight line formula.
(accept integer multiples) (A1)(ft)(G3)
[3 marks]
(M1)
Note: Award (M1) for substitution of into their equation of normal line or substitution of and into equation of gradient of normal.
(A1)(ft)(G2)
Note: Follow through from part (c).
[2 marks]
(M1)
Note: Award (M1) for correctly substituting point and their into distance formula.
(A1)(ft)
Note: Follow through from part (d).
[2 marks]
(M1)
Note: Award (M1) for their correct substitution into area of a triangle formula. Award (M0) for their without any evidence of multiplication by to find length . Accept any other correct method to find the area.
(A1)(ft)(G2)
Note: Accept from use of a sf value for . Follow through from part (e).
[2 marks]
Examiners report
Let for .
Let .
The function can be written in the form .
The range of is ≤ ≤ . Find and .
Find the range of .
Find the value of and of .
Find the period of .
The equation has two solutions where ≤ ≤ . Find both solutions.
Markscheme
* This question is from an exam for a previous syllabus, and may contain minor differences in marking or structure.
valid attempt to find range (M1)
eg  , max = 6 min = 2,
and , and ,
, A1A1 N3
[3 marks]
10 ≤ ≤ 30 A2 N2
[2 marks]
evidence of substitution (may be seen in part (b)) (M1)
eg ,
, (accept ) A1A1 N3
Note: If no working shown, award N2 for one correct value.
[3 marks]
correct working (A1)
eg
1.04719
, 1.05 A1 N2
[2 marks]
valid approach (M1)
eg  ,
,
Note: Award M1 for any correct value for or which lies outside the domain of .
3.81974, 4.03424
, (do not accept answers in degrees) A1A1 N3
[3 marks]
Examiners report
The graph of the quadratic function intersects the -axis at .
The vertex of the function is .
The equation has two solutions. The first solution is .
Let be the tangent at .
Find the value of .
Write down the equation for the axis of symmetry of the graph.
Use the symmetry of the graph to show that the second solution is .
Write down the -intercepts of the graph.
On graph paper, draw the graph of for and . Use a scale of to represent unit on the -axis and to represent units on the -axis.
Write down the equation of .
Draw the tangent on your graph.
Given and , state whether the function, , is increasing or decreasing at . Give a reason for your answer.
Markscheme
OR (or equivalent) (M1)
Note: Award (M1) for evaluating .
(A1)(G2)
Note: Award (G2) if or seen.
[2 marks]
(A1)(A1)
Note: Award (A1) for “ constant”, (A1) for the constant being . The answer must be an equation.
[2 marks]
(M1)
OR
(M1)
OR
(M1)
OR
diagram showing axis of symmetry and given points (-values labels, , and , are sufficient) and an indication that the horizontal distances between the axis of symmetry and the given points are . (M1)

Note: Award (M1) for correct working using the symmetry between and . Award (M0) if candidate has used and to show the axis of symmetry is . Award (M0) if candidate solved or evaluated and .
(AG)
[1 mark]
and (A1)(A1)
Note: Accept and or and , award at most (A0)(A1) if parentheses are omitted.
[2 marks]
 (A1)(A1)(A1)(A1)(ft)
Note: Award (A1) for labelled axes with correct scale, correct window. Award (A1) for the vertex, , in correct location.
Award (A1) for a smooth continuous curve symmetric about their vertex. Award (A1)(ft) for the curve passing through their and intercepts in correct location. Follow through from their parts (a) and (d).
If graph paper is not used:
Award at most (A0)(A0)(A1)(A1)(ft). Their graph should go through their and for the last (A1)(ft) to be awarded.
[4 marks]
OR (A1)(A1)
Note: Award (A1) for " constant", (A1) for the constant being . The answer must be an equation.
[2 marks]
tangent to the graph drawn at (A1)(ft)
Note: Award (A1) for a horizontal straight-line tangent to curve at approximately . Award (A0) if a ruler is not used. Follow through from their part (e).
[1 mark]
decreasing (A1)
gradient (of tangent line) is negative (at ) OR (R1)
Note: Do not accept "gradient (of tangent line) is ". Do not award (A1)(R0).
[2 marks]
Examiners report
The diagram below shows a circular clockface with centre . The clock’s minute hand has a length of . The clock’s hour hand has a length of .
At pm the endpoint of the minute hand is at point and the endpoint of the hour hand is at point .

Between pm and pm, the endpoint of the minute hand rotates through an angle, , from point to point . This is illustrated in the diagram.

A second clock is illustrated in the diagram below. The clock face has radius with minute and hour hands both of length . The time shown is am. The bottom of the clock face is located above a horizontal bookshelf.

The height, centimetres, of the endpoint of the minute hand above the bookshelf is modelled by the function
where is the angle rotated by the minute hand from am.
The height, centimetres, of the endpoint of the hour hand above the bookshelf is modelled by the function
where is the angle in degrees rotated by the minute hand from am.
Find the size of angle in degrees.
Find the distance between points and .
Find the size of angle in degrees.
Calculate the length of arc .
Calculate the area of the shaded sector, .
Write down the height of the endpoint of the minute hand above the bookshelf at am.
Find the value of when .
Write down the amplitude of .
The endpoints of the minute hand and hour hand meet when .
Find the smallest possible value of .
Markscheme
OR (M1)
A1
[2 marks]
substitution in cosine rule (M1)
(A1)
A1
Note: Follow through marks in part (b) are contingent on working seen.
[3 marks]
(M1)
A1
[2 marks]
substitution into the formula for arc length (M1)
OR
A1
[2 marks]
substitution into the area of a sector (M1)
OR
A1
[2 marks]
A1
[1 mark]
correct substitution (M1)
A1
[2 marks]
A1
[1 mark]
EITHER
(M1)
OR
 (M1)
(M1)
Note: Award M1 for equating the functions. Accept a sketch of and with point(s) of intersection marked.
THEN
A1
Note: The answer is incorrect but the correct method is implicit. Award (M1)A0.
[2 marks]
Examiners report
Boris recorded the number of daylight hours on the first day of each month in a northern hemisphere town.
This data was plotted onto a scatter diagram. The points were then joined by a smooth curve, with minimum point and maximum point as shown in the following diagram.

Let the curve in the diagram be , where is the time, measured in months, since Boris first recorded these values.
Boris thinks that might be modelled by a quadratic function.
Paula thinks that a better model is , , for specific values of and .
For Paula’s model, use the diagram to write down
The true maximum number of daylight hours was hours and minutes.
Write down one reason why a quadratic function would not be a good model for the number of hours of daylight per day, across a number of years.
the amplitude.
the period.
the equation of the principal axis.
Hence or otherwise find the equation of this model in the form:
For the first year of the model, find the length of time when there are more than hours and minutes of daylight per day.
Calculate the percentage error in the maximum number of daylight hours Boris recorded in the diagram.
Markscheme
EITHER
annual cycle for daylight length R1
OR
there is a minimum length for daylight (cannot be negative) R1
OR
a quadratic could not have a maximum and a minimum or equivalent R1
Note: Do not accept “Paula's model is better”.
[1 mark]
A1
[1 mark]
A1
[1 mark]
A1A1
Note: Award A1 “ (a constant)” and A1 for that constant being .
[2 marks]
OR A1A1A1
Note: Award A1 for (or ), A1 for , and A1 for . Award at most A1A1A0 if extra terms are seen or form is incorrect. Award at most A1A1A0 if is used instead of .
[3 marks]
(M1)
EITHER
(A1)(A1)
OR
(A1)
(A1)
THEN
months ( years) A1
Note: Award M1A1A1A0 for an unsupported answer of . If there is only one intersection point, award M1A1A0A0.
[4 marks]
(M1)(M1)
Note: Award M1 for correct values and absolute value signs, M1 for .
A1
[3 marks]
Examiners report
Part (a) indicated a lack of understanding of quadratic functions and the cyclical nature of daylight hours. Some candidates seemed to understand the limitations of a quadratic model but were not always able to use appropriate mathematical language to explain the limitations clearly.
In part (b), many candidates struggled to write down the amplitude, period, and equation of the principal axis.
In part (c), very few candidates recognized that it would be a negative cosine graph here and most did not know how to find the “b” value even if they had originally found the period in part (b). Some candidates used the regression features in their GDC to find the equation of the model; this is outside the SL syllabus but is a valid approach and earned full credit.
In part (d), very few candidates were awarded “follow through” marks in this part. Some substituted 10.5 into their equation rather that equate their equation to 10.5 and attempt to solve it using their GDC to graph the equations or using the “solver” function.
Part (e) was perhaps the best answered part in this question. However, due to premature rounding, many candidates did not gain full marks. A common error was to write the true number of daylight hours as 16.14.
The rate of change of the height of a ball above horizontal ground, measured in metres, seconds after it has been thrown and until it hits the ground, can be modelled by the equation
The height of the ball when is .
Find an expression for the height of the ball at time .
Find the value of at which the ball hits the ground.
Hence write down the domain of .
Find the range of .
Markscheme
* This sample question was produced by experienced DP mathematics senior examiners to aid teachers in preparing for external assessment in the new MAA course. There may be minor differences in formatting compared to formal exam papers.
M1
A1A1
When (M1)
(A1)
A1
[6 marks]
seconds (M1)A1
[2 marks]
A1
Note: Accept .
[1 mark]
Maximum value is (M1)
Range is A1A1
Note: Accept .
[3 marks]
Examiners report
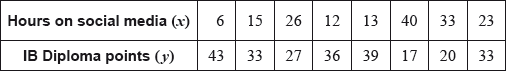
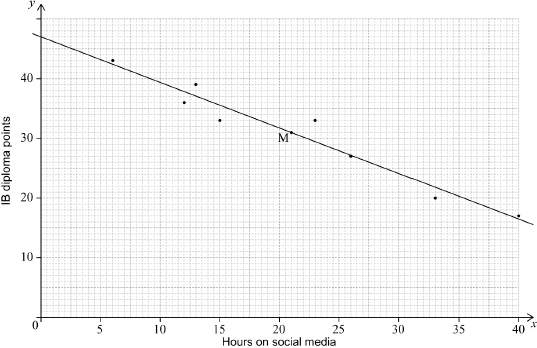
In the month before their IB Diploma examinations, eight male students recorded the number of hours they spent on social media.
For each student, the number of hours spent on social media () and the number of IB Diploma points obtained () are shown in the following table.
Use your graphic display calculator to find
Ten female students also recorded the number of hours they spent on social media in the month before their IB Diploma examinations. Each of these female students spent between 3 and 30 hours on social media.
The equation of the regression line y on x for these ten female students is
An eleventh girl spent 34 hours on social media in the month before her IB Diploma examinations.
On graph paper, draw a scatter diagram for these data. Use a scale of 2 cm to represent 5 hours on the -axis and 2 cm to represent 10 points on the -axis.
(i) , the mean number of hours spent on social media;
(ii) , the mean number of IB Diploma points.
Plot the point on your scatter diagram and label this point M.
Write down the equation of the regression line on for these eight male students.
Draw the regression line, from part (e), on your scatter diagram.
Use the given equation of the regression line to estimate the number of IB Diploma points that this girl obtained.
Write down a reason why this estimate is not reliable.
Markscheme
* This question is from an exam for a previous syllabus, and may contain minor differences in marking or structure.
 (A4)
(A4)
Notes: Award (A1) for correct scale and labelled axes.
Award (A3) for 7 or 8 points correctly plotted,
(A2) for 5 or 6 points correctly plotted,
(A1) for 3 or 4 points correctly plotted.
Award at most (A0)(A3) if axes reversed.
Accept and sufficient for labelling.
If graph paper is not used, award (A0).
If an inconsistent scale is used, award (A0). Candidates’ points should be read from this scale where possible and awarded accordingly.
A scale which is too small to be meaningful (ie mm instead of cm) earns (A0) for plotted points.
[4 marks]
(i) (A1)
(ii) (A1)
[2 marks]
correctly plotted on graph (A1)(ft)
this point labelled M (A1)
Note: Follow through from parts (b)(i) and (b)(ii).
Only accept M for labelling.
[2 marks]
(A1)(A1)(G2)
Notes: Award (A1) for and (A1) . Award a maximum of (A1)(A0) if answer is not an equation.
[2 marks]
line on graph (A1)(ft)(A1)(ft)
Notes: Award (A1)(ft) for straight line that passes through their M, (A1)(ft) for line (extrapolated if necessary) that passes through .
If M is not plotted or labelled, follow through from part (e).
[2 marks]
(M1)
Note: Award (M1) for correct substitution.
19 (points) (A1)(G2)
[2 marks]
extrapolation (R1)
OR
34 hours is outside the given range of data (R1)
Note: Do not accept ‘outlier’.
[1 mark]
Examiners report
The braking distance of a vehicle is defined as the distance travelled from where the brakes are applied to the point where the vehicle comes to a complete stop.
The speed, , and braking distance, , of a truck were recorded. This information is summarized in the following table.

This information was used to create Model A, where is a function of , ≥ 0.
Model A: , where ,
At a speed of , Model A can be represented by the equation .
Additional data was used to create Model B, a revised model for the braking distance of a truck.
Model B:
The actual braking distance at is .
Write down a second equation to represent Model A, when the speed is .
Find the values of and .
Find the coordinates of the vertex of the graph of .
Using the values in the table and your answer to part (b), sketch the graph of for 0 ≤ ≤ 10 and −10 ≤ ≤ 60, clearly showing the vertex.
Hence, identify why Model A may not be appropriate at lower speeds.
Use Model B to calculate an estimate for the braking distance at a speed of .
Calculate the percentage error in the estimate in part (e).
It is found that once a driver realizes the need to stop their vehicle, 1.6 seconds will elapse, on average, before the brakes are engaged. During this reaction time, the vehicle will continue to travel at its original speed.
A truck approaches an intersection with speed . The driver notices the intersection’s traffic lights are red and they must stop the vehicle within a distance of .

Using model B and taking reaction time into account, calculate the maximum possible speed of the truck if it is to stop before the intersection.
Markscheme
M1
A1
[2 marks]
, A1A1
Note: If and are both incorrect then award M1A0 for an attempt to solve simultaneous equations.
[2 marks]
(2, −4) A1A1
Note: Award A1 for each correct coordinate.
Award A0A1 if parentheses are missing.
[2 marks]
 A3
A3
Note: Award A1 for smooth quadratic curve on labelled axes and within correct window.
Award A1 for the curve passing through (0, 0) and (10, 60). Award A1 for the curve passing through their vertex. Follow through from part (b).
[3 marks]
the graph indicates there are negative stopping distances (for low speeds) R1
Note: Award R1 for identifying that a feature of their graph results in negative stopping distances (vertex, range of stopping distances…).
[1 mark]
(M1)
A1
[2 marks]
M1
(%) A1
[2 marks]
M1A1
Note: Award M1 for an attempt to find an expression including stopping distance (model B) and reaction distance, equated to 330. Award A1 for a completely correct equation.
A1
[3 marks]
Examiners report
Consider the function , where x > 0 and k is a constant.
The graph of the function passes through the point with coordinates (4 , 2).
P is the minimum point of the graph of f (x).
Find the value of k.
Using your value of k , find f ′(x).
Use your answer to part (b) to show that the minimum value of f(x) is −22 .
Sketch the graph of y = f (x) for 0 < x ≤ 6 and −30 ≤ y ≤ 60.
Clearly indicate the minimum point P and the x-intercepts on your graph.
Markscheme
* This question is from an exam for a previous syllabus, and may contain minor differences in marking or structure.
(M1)
Note: Award (M1) for correct substitution of x = 4 and y = 2 into the function.
k = 3 (A1) (G2)
[2 marks]
(A1)(A1)(A1)(ft) (G3)
Note: Award (A1) for −48 , (A1) for x−2, (A1)(ft) for their 6x. Follow through from part (a). Award at most (A1)(A1)(A0) if additional terms are seen.
[3 marks]
(M1)
Note: Award (M1) for equating their part (b) to zero.
x = 2 (A1)(ft)
Note: Follow through from part (b). Award (M1)(A1) for seen.
Award (M0)(A0) for x = 2 seen either from a graphical method or without working.
(M1)
Note: Award (M1) for substituting their 2 into their function, but only if the final answer is −22. Substitution of the known result invalidates the process; award (M0)(A0)(M0).
−22 (AG)
[3 marks]
 (A1)(A1)(ft)(A1)(ft)(A1)(ft)
Note: Award (A1) for correct window. Axes must be labelled.
(A1)(ft) for a smooth curve with correct shape and zeros in approximately correct positions relative to each other.
(A1)(ft) for point P indicated in approximately the correct position. Follow through from their x-coordinate in part (c). (A1)(ft) for two x-intercepts identified on the graph and curve reflecting asymptotic properties.
[4 marks]
Examiners report
A cafe makes litres of coffee each morning. The cafe’s profit each morning, , measured in dollars, is modelled by the following equation
where is a positive constant.
The cafe’s manager knows that the cafe makes a profit of when litres of coffee are made in a morning.
The manager of the cafe wishes to serve as many customers as possible.
Find an expression for in terms of and .
Hence find the maximum value of in terms of . Give your answer in the form , where is a constant.
Find the value of .
Use the model to find how much coffee the cafe should make each morning to maximize its profit.
Sketch the graph of against , labelling the maximum point and the -intercepts with their coordinates.
Determine the maximum amount of coffee the cafe can make that will not result in a loss of money for the morning.
Markscheme
attempt to expand given expression (M1)
M1A1
Note: Award M1 for power rule correctly applied to at least one term and A1 for correct answer.
[3 marks]
equating their to zero (M1)
(A1)
substituting their back into given expression (M1)
A1
[4 marks]
substituting into given expression and equating to M1
A1
[2 marks]
A1
[1 mark]
 A1A1A1
Note: Award A1 for graph drawn for positive indicating an increasing and then decreasing function, A1 for maximum labelled and A1 for graph passing through the origin and , marked on the -axis or whose coordinates are given.
[3 marks]
setting their expression for to zero OR choosing correct -intercept on their graph of (M1)
litres A1
[2 marks]
Examiners report
Let . The line is tangent to the graph of at .
can be expressed in the form r u.
The direction vector of is .
Find the gradient of .
Find u.
Find the acute angle between and .
Find .
Hence, write down .
Hence or otherwise, find the obtuse angle formed by the tangent line to at and the tangent line to at .
Markscheme
* This question is from an exam for a previous syllabus, and may contain minor differences in marking or structure.
attempt to find (M1)
eg , ,
−0.25 (exact) A1 N2
[2 marks]
u or any scalar multiple A2 N2
[2 marks]
correct scalar product and magnitudes (A1)(A1)(A1)
scalar product
magnitudes ,
substitution of their values into correct formula (M1)
eg , , 2.1112, 120.96°
1.03037 , 59.0362°
angle = 1.03 , 59.0° A1 N4
[5 marks]
attempt to form composite (M1)
eg , ,
correct working (A1)
eg ,
A1 N2
[3 marks]
(accept , ) A1 N1
Note: Award A0 in part (ii) if part (i) is incorrect.
Award A0 in part (ii) if the candidate has found by interchanging and .
[1 mark]
METHOD 1
recognition of symmetry about (M1)
eg (2, 8) ⇔ (8, 2) 
evidence of doubling their angle (M1)
eg ,
2.06075, 118.072°
2.06 (radians) (118 degrees) A1 N2
METHOD 2
finding direction vector for tangent line at (A1)
eg ,
substitution of their values into correct formula (must be from vectors) (M1)
eg ,
2.06075, 118.072°
2.06 (radians) (118 degrees) A1 N2
METHOD 3
using trigonometry to find an angle with the horizontal (M1)
eg ,
finding both angles of rotation (A1)
eg ,
2.06075, 118.072°
2.06 (radians) (118 degrees) A1 N2
[3 marks]
Examiners report
The depth of water in a port is modelled by the function , for , where is the number of hours after high tide.
At high tide, the depth is 9.7 metres.
At low tide, which is 7 hours later, the depth is 5.3 metres.
Find the value of .
Find the value of .
Use the model to find the depth of the water 10 hours after high tide.
Markscheme
* This question is from an exam for a previous syllabus, and may contain minor differences in marking or structure.
valid approach (M1)
eg, sketch of graph,
A1 N2
[2 marks]
valid approach (M1)
eg, period is
0.448798
, (do not accept degrees) A1 N2
[2 marks]
valid approach (M1)
eg
7.01045
7.01 (m) A1 N2
[2 marks]
Examiners report
Consider the function , where is a constant. Part of the graph of is shown below.

It is known that at the point where the tangent to the graph of is horizontal.
There are two other points on the graph of at which the tangent is horizontal.
Write down the -intercept of the graph.
Find .
Show that .
Find .
Write down the -coordinates of these two points;
Write down the intervals where the gradient of the graph of is positive.
Write down the range of .
Write down the number of possible solutions to the equation .
The equation , where , has four solutions. Find the possible values of .
Markscheme
* This question is from an exam for a previous syllabus, and may contain minor differences in marking or structure.
5 (A1)
Note: Accept an answer of .
[1 mark]
(A1)(A1)
Note: Award (A1) for and (A1) for . Award at most (A1)(A0) if extra terms are seen.
[2 marks]
(M1)(M1)
Note: Award (M1) for substitution of into their derivative, (M1) for equating their derivative, written in terms of , to 0 leading to a correct answer (note, the 8 does not need to be seen).
(AG)
[2 marks]
(M1)
Note: Award (M1) for correct substitution of and into the formula of the function.
21 (A1)(G2)
[2 marks]
(A1)(A1)
Note: Award (A1) for each correct solution. Award at most (A0)(A1)(ft) if answers are given as and or and .
[2 marks]
(A1)(ft)(A1)(ft)
Note: Award (A1)(ft) for , follow through from part (d)(i) provided their value is negative.
Award (A1)(ft) for , follow through only from their 0 from part (d)(i); 2 must be the upper limit.
Accept interval notation.
[2 marks]
(A1)(ft)(A1)
Notes: Award (A1)(ft) for 21 seen in an interval or an inequality, (A1) for “”.
Accept interval notation.
Accept or .
Follow through from their answer to part (c)(ii). Award at most (A1)(ft)(A0) if is seen instead of . Do not award the second (A1) if a (finite) lower limit is seen.
[2 marks]
3 (solutions) (A1)
[1 mark]
or equivalent (A1)(ft)(A1)
Note: Award (A1)(ft) for 5 and 21 seen in an interval or an inequality, (A1) for correct strict inequalities. Follow through from their answers to parts (a) and (c)(ii).
Accept interval notation.
[2 marks]
Examiners report
Let and , for .
Find .
Find .
Solve .
Markscheme
* This question is from an exam for a previous syllabus, and may contain minor differences in marking or structure.
attempt to substitute (M1)
eg
A1 N2
[2 marks]
attempt to form composition (in any order) (M1)
eg
A1 N2
[2 marks]
valid approach (M1)
eg , 
A1A1 N3
[3 marks]
Examiners report
Consider the function
Find .
Solve .
The graph of has a local minimum at point .
Find the coordinates of .
Markscheme
* This question is from an exam for a previous syllabus, and may contain minor differences in marking or structure.
attempt to substitute (M1)
eg
(exact) A1 N2
[2 marks]
A2 N2
[2 marks]
A1A1 N2
[2 marks]
Examiners report
The following diagram shows a water wheel with centre and radius metres. Water flows into buckets, turning the wheel clockwise at a constant speed.
The height, metres, of the top of a bucket above the ground seconds after it passes through point is modelled by the function
, for .

A bucket moves around to point which is at a height of metres above the ground. It takes seconds for the top of this bucket to go from point to point .
The chord is metres, correct to three significant figures.
Find the height of point above the ground.
Calculate the number of seconds it takes for the water wheel to complete one rotation.
Hence find the number of rotations the water wheel makes in one hour.
Find .
Find .
Determine the rate of change of when the top of the bucket is at .
Markscheme
valid approach (M1)
eg
(metres) A1 N2
[2 marks]
valid approach to find the period (seen anywhere) (M1)
eg , attempt to find two consecutive max/min,
(seconds) (exact) A1 N2
[2 marks]
correct approach (A1)
eg rotations per minute
(rotations) A1 N2
[2 marks]
correct substitution into equation (accept the use of ) (A1)
eg
valid attempt to solve their equation (M1)
eg 
A1 N3
[3 marks]
METHOD 1
evidence of choosing the cosine rule or sine rule (M1)
eg
correct working (A1)
eg
A1 N3
METHOD 2
attempt to find the half central angle (M1)
eg
correct working (A1)
eg
A1 N3
METHOD 3
valid approach to find fraction of period (M1)
eg
correct approach to find angle (A1)
eg
( using )
A1 N3
[3 marks]
recognizing rate of change is (M1)
eg
( from )
rate of change is A1 N2
( from )
[2 marks]
Examiners report
Scott purchases food for his dog in large bags and feeds the dog the same amount of dog food each day. The amount of dog food left in the bag at the end of each day can be modelled by an arithmetic sequence.
On a particular day, Scott opened a new bag of dog food and fed his dog. By the end of the third day there were cups of dog food remaining in the bag and at the end of the eighth day there were cups of dog food remaining in the bag.
Find the number of cups of dog food
In , Scott spent on dog food. Scott expects that the amount he spends on dog food will increase at an annual rate of .
fed to the dog per day.
remaining in the bag at the end of the first day.
Calculate the number of days that Scott can feed his dog with one bag of food.
Determine the amount that Scott expects to spend on dog food in . Round your answer to the nearest dollar.
Calculate the value of .
Describe what the value in part (d)(i) represents in this context.
Comment on the appropriateness of modelling this scenario with a geometric sequence.
Markscheme
EITHER
(M1)(A1)
Note: Award M1 for attempting to use the arithmetic sequence term formula, A1 for both equations correct. Working for M1 and A1 can be found in parts (i) or (ii).
(cups/day) A1
Note: Answer must be written as a positive value to award A1.
OR
(M1)(A1)
Note: Award M1 for attempting a calculation using the difference between term and term ; A1 for a correct substitution.
(cups/day) A1
[3 marks]
(cups) A1
[1 mark]
attempting to substitute their values into the term formula for arithmetic sequence equated to zero (M1)
days A1
Note: Follow through from part (a) only if their answer is positive.
[2 marks]
(M1)(A1)
Note: Award M1 for attempting to use the geometric sequence term formula; A1 for a correct substitution
A1
Note: The answer must be rounded to a whole number to award the final A1.
[3 marks]
A1
[1 mark]
EITHER
the total cost (of dog food) R1
for years beginning in OR years before R1
OR
the total cost (of dog food) R1
from to (inclusive) OR from to (the start of) R1
[2 marks]
EITHER
According to the model, the cost of dog food per year will eventually be too high to keep a dog.
OR
The model does not necessarily consider changes in inflation rate.
OR
The model is appropriate as long as inflation increases at a similar rate.
OR
The model does not account for changes in the amount of food the dog eats as it ages/becomes ill/stops growing.
OR
The model is appropriate since dog food bags can only be bought in discrete quantities. R1
Note: Accept reasonable answers commenting on the appropriateness of the model for the specific scenario. There should be a reference to the given context. A reference to the geometric model must be clear: either “model” is mentioned specifically, or other mathematical terms such as “increasing” or “discrete quantities” are seen. Do not accept a contextual argument in isolation, e.g. “The dog will eventually die”.
[1 mark]
Examiners report
Parts (a) and (b) were mostly well answered, but some candidates ignored the context and did not give the number of dog food cups per day as a positive number. Most candidates considered geometric sequence in part (c) correctly, and used the correct formula for the nth term, although they used an incorrect value for n at times. Some candidates used the finance application incorrectly. The sum in part (d) was calculated correctly by some candidates, although many seemed unfamiliar with sigma notation and with calculating summations using GDC. In part (d), most candidates interpreted correctly that the sum represented the cost of dog food for 10 years but did not identify the specific 10-year period. Part (e) was not answered well – often candidates made very general and abstract statements devoid of any contextual references.
Consider the function ,
The function , , models the path of a river, as shown on the following map, where both axes represent distance and are measured in kilometres. On the same map, the location of a highway is defined by the function .

The origin, O(0, 0) , is the location of the centre of a town called Orangeton.
A straight footpath, , is built to connect the centre of Orangeton to the river at the point where .
Bridges are located where the highway crosses the river.
A straight road is built from the centre of Orangeton, due north, to connect the town to the highway.
State the domain of .
Find the distance from the centre of Orangeton to the point at which the road meets the highway.
This straight road crosses the highway and then carries on due north.
State whether the straight road will ever cross the river. Justify your answer.
Markscheme
0 < < (A1)(A1)
Note: Award (A1) for both endpoints correct, (A1) for correct mathematical notation indicating an interval with two endpoints. Accept weak inequalities. Award at most (A1)(A0) for incorrect notation such as 0 − 0.5 or a written description of the domain with correct endpoints. Award at most (A1)(A0) for 0 < < .
[2 marks]
(M1)
1.5 (km) (A1)(G2)
[2 marks]
domain given as (but equation of road is ) (R1)
OR
(equation of road is ) the function of the river is asymptotic to (R1)
so it does not meet the river (A1)
Note: Award the (R1) for a correct mathematical statement about the equation of the river (and the equation of the road). Justification must be based on mathematical reasoning. Do not award (R0)(A1).
[2 marks]
Examiners report
Note: In this question, distance is in millimetres.
Let , for .
The graph of passes through the origin. Let be any point on the graph of with -coordinate , where . A straight line passes through all the points .
Diagram 1 shows a saw. The length of the toothed edge is the distance AB.
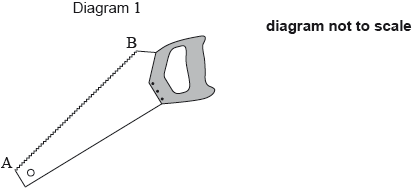
The toothed edge of the saw can be modelled using the graph of and the line . Diagram 2 represents this model.
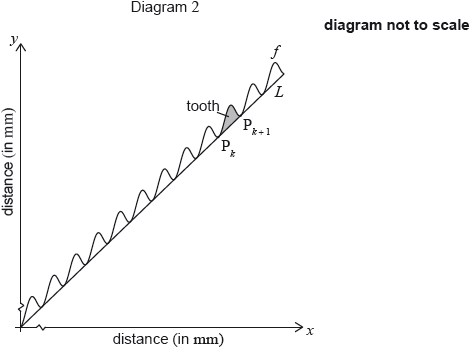
The shaded part on the graph is called a tooth. A tooth is represented by the region enclosed by the graph of and the line , between and .
Show that .
Find the coordinates of and of .
Find the equation of .
Show that the distance between the -coordinates of and is .
A saw has a toothed edge which is 300 mm long. Find the number of complete teeth on this saw.
Markscheme
* This question is from an exam for a previous syllabus, and may contain minor differences in marking or structure.
substituting M1
eg
(A1)
A1
AG N0
[3 marks]
substituting the value of (M1)
A1A1 N3
[3 marks]
attempt to find the gradient (M1)
eg
correct working (A1)
eg
y = x A1 N3
[3 marks]
subtracting -coordinates of and (in any order) (M1)
eg
correct working (must be in correct order) A1
eg
distance is AG N0
[2 marks]
METHOD 1
recognizing the toothed-edge as the hypotenuse (M1)
eg, sketch
correct working (using their equation of (A1)
eg
(exact), 212.132 (A1)
dividing their value of by (M1)
eg
33.7618 (A1)
33 (teeth) A1 N2
METHOD 2
vertical distance of a tooth is (may be seen anywhere) (A1)
attempt to find the hypotenuse for one tooth (M1)
eg
(exact), 8.88576 (A1)
dividing 300 by their value of (M1)
eg
33.7618 (A1)
33 (teeth) A1 N2
[6 marks]
Examiners report
The Voronoi diagram below shows four supermarkets represented by points with coordinates , , and . The vertices , , are also shown. All distances are measured in kilometres.

The equation of is and the equation of is .
The coordinates of are and the coordinates of are .
A town planner believes that the larger the area of the Voronoi cell , the more people will shop at supermarket .
Find the midpoint of .
Find the equation of .
Find the coordinates of .
Determine the exact length of .
Given that the exact length of is , find the size of in degrees.
Hence find the area of triangle .
State one criticism of this interpretation.
Markscheme
(M1)
A1
Note: Award A0 if parentheses are omitted in the final answer.
[2 marks]
attempt to substitute values into gradient formula (M1)
(A1)
therefore the gradient of perpendicular bisector is (M1)
so A1
[4 marks]
identifying the correct equations to use: (M1)
and
evidence of solving their correct equations or of finding intersection point graphically (M1)
A1
Note: Accept an answer expressed as “”.
[3 marks]
attempt to use distance formula (M1)
A1
[2 marks]
METHOD 1 (cosine rule)
length of is (A1)
Note: Accept and .
attempt to substitute into cosine rule (M1)
(A1)
Note: Award A1 for correct substitution of , , values in the cos rule. Exact values do not need to be used in the substitution.
A1
Note: Last A1 mark may be lost if prematurely rounded values of , and/or are used.
METHOD 2 (splitting isosceles triangle in half)
length of is (A1)
Note: Accept and .
required angle is (M1)(A1)
Note: Award A1 for correct substitution of (or ), values in the cos rule. Exact values do not need to be used in the substitution.
A1
Note: Last A1 mark may be lost if prematurely rounded values of , and/or are used.
[4 marks]
(area =) OR (area =) (M1)
A1
[2 marks]
Any sensible answer such as:
There might be factors other than proximity which influence shopping choices.
A larger area does not necessarily result in an increase in population.
The supermarkets might be specialized / have a particular clientele who visit even if other shops are closer.
Transport links might not be represented by Euclidean distances.
etc. R1
[1 mark]
Examiners report
Part (a) was answered very well and demonstrated that the candidates had good knowledge of the midpoint formula. Some candidates did not write the midpoint they found as a coordinate pair and lost a mark there. Part (b) was answered well. Most candidates were able to find the gradient of [BD] and then the gradient of the perpendicular [XZ] and its equation. Candidates who lost marks in (b) were able to collect follow through marks in parts (c), (d), and (e). In part (c), not all candidates were able to identify the correct equations that they needed to find the coordinates of point X. In part (d), many candidates overlooked the fact that the question called for the exact length of [YZ] – the majority of candidates gave the answer correct to three significant figures and hence lost a mark. In part (d) most candidates were able to correctly use the cosine rule. Marks were lost here if the candidates calculated the length of [XZ] incorrectly, or substituted the [XZ], [YZ] or [XY] values incorrectly. Often candidates used rounded [XZ], [YZ] or [XY] values prematurely, for which they lost the last mark. Part (f) was mostly well answered. If candidates found an angle in part (e), they were usually able to find the area in (f) correctly. Again, the contextual question in part (g) was challenging to many candidates. Some answers showed misconceptions about Voronoi diagrams, for example some candidates stated that “if the cell were larger, then some people living there will be much closer to supermarkets A, B, C than to supermarket D.” Many candidates offered explanations, which were long and unclear, which often did not address the issue they were asked to comment on, nor displayed a sound understanding of the topic.
All lengths in this question are in metres.
Let , for . Mark uses as a model to create a barrel. The region enclosed by the graph of , the -axis, the line and the line is rotated 360° about the -axis. This is shown in the following diagram.
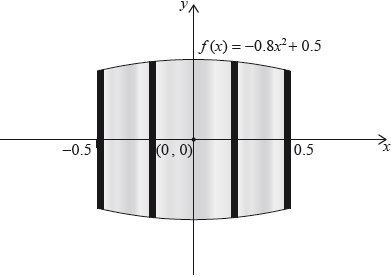
Use the model to find the volume of the barrel.
The empty barrel is being filled with water. The volume of water in the barrel after minutes is given by . How long will it take for the barrel to be half-full?
Markscheme
* This question is from an exam for a previous syllabus, and may contain minor differences in marking or structure.
attempt to substitute correct limits or the function into the formula involving
eg
0.601091
volume A2 N3
[3 marks]
attempt to equate half their volume to (M1)
eg, graph
4.71104
4.71 (minutes) A2 N3
[3 marks]
Examiners report
Let , be a periodic function with
The following diagram shows the graph of .

There is a maximum point at A. The minimum value of is −13 .
A ball on a spring is attached to a fixed point O. The ball is then pulled down and released, so that it moves back and forth vertically.

The distance, d centimetres, of the centre of the ball from O at time t seconds, is given by
Find the coordinates of A.
For the graph of , write down the amplitude.
For the graph of , write down the period.
Hence, write in the form .
Find the maximum speed of the ball.
Find the first time when the ball’s speed is changing at a rate of 2 cm s−2.
Markscheme
* This question is from an exam for a previous syllabus, and may contain minor differences in marking or structure.
−0.394791,13
A(−0.395, 13) A1A1 N2
[2 marks]
13 A1 N1
[1 mark]
, 6.28 A1 N1
[1 mark]
valid approach (M1)
eg recognizing that amplitude is p or shift is r
(accept p = 13, r = 0.395) A1A1 N3
Note: Accept any value of r of the form
[3 marks]
recognizing need for d ′(t) (M1)
eg −12 sin(t) − 5 cos(t)
correct approach (accept any variable for t) (A1)
eg −13 sin(t + 0.395), sketch of d′, (1.18, −13), t = 4.32
maximum speed = 13 (cms−1) A1 N2
[3 marks]
recognizing that acceleration is needed (M1)
eg a(t), d "(t)
correct equation (accept any variable for t) (A1)
eg
valid attempt to solve their equation (M1)
eg sketch, 1.33
1.02154
1.02 A2 N3
[5 marks]
Examiners report
Consider the function .
Find .
Find the gradient of the graph of at .
Find the equation of the tangent line to the graph of at . Give the equation in the form where, , , and .
Markscheme
(A1)(A1)(A1)
Note: Award (A1) for each correct term. Award at most (A1)(A1)(A0) if there are extra terms.
[3 marks]
(M1)
Note: Award (M1) for correct substitution of 2 in their derivative of the function.
6 (A1)(ft)(G2)
Note: Follow through from part (d).
[2 marks]
(M1)
Note: Award (M1) for 2, their part (a) and their part (e) substituted into equation of a straight line.
OR
(M1)
Note: Award (M1) for 2, their part (a) and their part (e) substituted into equation of a straight line.
OR
(M1)
Note: Award (M1) for their answer to (e) and intercept substituted in the gradient-intercept line equation.
(accept integer multiples) (A1)(ft)(G2)
Note: Follow through from parts (a) and (e).
[2 marks]
Examiners report
The following diagram shows the graph of , for .

The graph of has a minimum point at and a maximum point at .
The graph of is obtained from the graph of by a translation of . The maximum point on the graph of has coordinates .
The graph of changes from concave-up to concave-down when .
(i) Find the value of .
(ii) Show that .
(iii) Find the value of .
(i) Write down the value of .
(ii) Find .
(i) Find .
(ii) Hence or otherwise, find the maximum positive rate of change of .
Markscheme
* This question is from an exam for a previous syllabus, and may contain minor differences in marking or structure.
(i) valid approach (M1)
eg
A1 N2
(ii) valid approach (M1)
egperiod is 12, per
A1
AG N0
(iii) METHOD 1
valid approach (M1)
eg, substitution of points
A1 N2
METHOD 2
valid approach (M1)
eg, amplitude is 6
A1 N2
[6 marks]
(i) A1 N1
(ii) A2 N2
[3 marks]
(i) METHOD 1 Using
recognizing that a point of inflexion is required M1
egsketch, recognizing change in concavity
evidence of valid approach (M1)
eg, sketch, coordinates of max/min on
(exact) A1 N2
METHOD 2 Using
recognizing that a point of inflexion is required M1
egsketch, recognizing change in concavity
evidence of valid approach involving translation (M1)
eg, sketch,
(exact) A1 N2
(ii) valid approach involving the derivative of or (seen anywhere) (M1)
eg, max on derivative, sketch of derivative
attempt to find max value on derivative M1
eg, dot on max of sketch
3.14159
max rate of change (exact), 3.14 A1 N2
[6 marks]
Examiners report
A theatre set designer is designing a piece of flat scenery in the shape of a hill. The scenery is formed by a curve between two vertical edges of unequal height. One edge is metres high and the other is metre high. The width of the scenery is metres.
A coordinate system is formed with the origin at the foot of the metres high edge. In this coordinate system the highest point of the cross‐section is at .

A set designer wishes to work out an approximate value for the area of the scenery .
In order to obtain a more accurate measure for the area the designer decides to model the curved edge with the polynomial where metres is the height of the curved edge a horizontal distance from the origin.
Explain why .
By dividing the area between the curve and the ‐axis into two trapezoids of unequal width show that , justifying the direction of the inequality.
Write down the value of .
Use differentiation to show that .
Determine two other linear equations in , and .
Hence find an expression for .
Use the expression found in (f) to calculate a value for .
Markscheme
* This sample question was produced by experienced DP mathematics senior examiners to aid teachers in preparing for external assessment in the new MAA course. There may be minor differences in formatting compared to formal exam papers.
The area is less than the rectangle containing the cross-section which is equal to R1
Note: is not sufficient for R1.
[1 mark]
(M1)(A1)
A1
This is an underestimate as the trapezoids are enclosed by (are under) the curve. R1
Note: This can be shown in a diagram.
[4 marks]
A1
[1 mark]
A1
M1
hence AG
[2 marks]
Substitute the points and (M1)
and
A1A1
[3 marks]
Solve on a GDC (M1)
A2
[3 marks]
(M1)A1
Note: Accept from the three significant figure answer to part (g).
[2 marks]
Examiners report
At an amusement park, a Ferris wheel with diameter 111 metres rotates at a constant speed. The bottom of the wheel is k metres above the ground. A seat starts at the bottom of the wheel.

The wheel completes one revolution in 16 minutes.
After t minutes, the height of the seat above ground is given by , for 0 ≤ t ≤ 32.
Find when the seat is 30 m above the ground for the third time.
Markscheme
valid approach (M1)
eg sketch of h and
18.4630
t = 18.5 (minutes) A1 N3
[3 marks]
Examiners report
A new concert hall was built with seats in the first row. Each subsequent row of the hall has two more seats than the previous row. The hall has a total of rows.
Find:
The concert hall opened in . The average number of visitors per concert during that year was . In , the average number of visitors per concert increased by .
The concert organizers use this data to model future numbers of visitors. It is assumed that the average number of visitors per concert will continue to increase each year by .
the number of seats in the last row.
the total number of seats in the concert hall.
Find the average number of visitors per concert in .
Determine the first year in which this model predicts the average number of visitors per concert will exceed the total seating capacity of the concert hall.
It is assumed that the concert hall will host concerts each year.
Use the average number of visitors per concert per year to predict the total number of people expected to attend the concert hall from when it opens until the end of .
Markscheme
recognition of arithmetic sequence with common difference (M1)
use of arithmetic sequence formula (M1)
A1
[3 marks]
use of arithmetic series formula (M1)
A1
[2 marks]
OR (M1)
A1
Note: Award M0A0 if incorrect used in part (b), and FT with their in parts (c) and (d).
[2 marks]
recognition of geometric sequence (M1)
equating their th geometric sequence term to their (M1)
Note: Accept inequality.
METHOD 1
EITHER
A1
A1
A1
OR
A1
A1
A1
METHOD 2
11th term (M1)A1
12th term (M1)A1
A1
Note: The last mark can be awarded if both their 11th and 12th correct terms are seen.
[5 marks]
seen (A1)
EITHER
(M1)
multiplying their sum by (M1)
OR
sum of the number of visitors for their and their seven years (M1)
multiplying their sum by (M1)
OR
(M1)(M1)
THEN
A1
Note: Follow though from their from part (b).
[4 marks]
Examiners report
The following diagram shows the graph of a function , for .
The points and lie on the graph of . There is a minimum point at .

Write down the range of .
Markscheme
* This question is from an exam for a previous syllabus, and may contain minor differences in marking or structure.
correct interval A2 N2
eg, from 0 to 6
[2 marks]
Examiners report
A hollow chocolate box is manufactured in the form of a right prism with a regular hexagonal base. The height of the prism is , and the top and base of the prism have sides of length .

Given that , show that the area of the base of the box is equal to .
Given that the total external surface area of the box is , show that the volume of the box may be expressed as .
Sketch the graph of , for .
Find an expression for .
Find the value of which maximizes the volume of the box.
Hence, or otherwise, find the maximum possible volume of the box.
The box will contain spherical chocolates. The production manager assumes that they can calculate the exact number of chocolates in each box by dividing the volume of the box by the volume of a single chocolate and then rounding down to the nearest integer.
Explain why the production manager is incorrect.
Markscheme
evidence of splitting diagram into equilateral triangles M1
area A1
AG
Note: The AG line must be seen for the final A1 to be awarded.
[2 marks]
total surface area of prism M1A1
Note: Award M1 for expressing total surface areas as a sum of areas of rectangles and hexagons, and A1 for a correctly substituted formula, equated to .
A1
volume of prism (M1)
A1
AG
Note: The AG line must be seen for the final A1 to be awarded.
[5 marks]
 A1A1
A1A1
Note: Award A1 for correct shape, A1 for roots in correct place with some indication of scale (indicated by a labelled point).
[2 marks]
A1A1
Note: Award A1 for a correct term.
[2 marks]
from the graph of or OR solving (M1)
A1
[2 marks]
from the graph of OR substituting their value for into (M1)
A1
[2 marks]
EITHER
wasted space / spheres do not pack densely (tesselate) A1
OR
the model uses exterior values / assumes infinite thinness of materials and hence the modelled volume is not the true volume A1
[1 mark]