
HL Paper 1
The function is defined by where .
Find the remainder when is divided by .
Find the remainder when is divided by .
Prove that has only one real zero.
Write down the transformation that will transform the graph of onto the graph of .
The random variable follows a Poisson distribution with a mean of and .
Find the value of .
The following table shows the time, in days, from December and the percentage of Christmas trees in stock at a shop on the beginning of that day.

The following table shows the natural logarithm of both and on these days to decimal places.

Use the data in the second table to find the value of and the value of for the regression line, .
Assuming that the model found in part (a) remains valid, estimate the percentage of trees in stock when .
The weights of apples from Tony’s farm follow a normal distribution with mean and standard deviation . The apples are sold in bags that contain six apples.
Find the mean weight of a bag of apples.
Find the standard deviation of the weights of these bags of apples.
Find the probability that a bag selected at random weighs more than .
A manufacturer of chocolates produces them in individual packets, claiming to have an average of chocolates per packet.
Talha bought of these packets in order to check the manufacturer’s claim.
Given that the number of individual chocolates is , Talha found that, from his packets, and .
Find an unbiased estimate for the mean number of chocolates per packet.
Use the formula to determine an unbiased estimate for the variance of the number of chocolates per packet.
Find a confidence interval for . You may assume that all conditions for a confidence interval have been met.
Suggest, with justification, a valid conclusion that Talha could make.
A factory, producing plastic gifts for a fast food restaurant’s Jolly meals, claims that just of the toys produced are faulty.
A restaurant manager wants to test this claim. A box of toys is delivered to the restaurant. The manager checks all the toys in this box and four toys are found to be faulty.
The restaurant manager performs a one-tailed hypothesis test, at the significance level, to determine whether the factory’s claim is reasonable. It is known that faults in the toys occur independently.
Identify the type of sampling used by the restaurant manager.
Write down the null and alternative hypotheses.
Find the -value for the test.
State the conclusion of the test. Give a reason for your answer.
Saloni wants to find a model for the temperature of a bottle of water after she removes it from the fridge. She uses a temperature probe to record the temperature of the water, every 5 minutes.

After graphing the data, Saloni believes a suitable model will be
, where .
Explain why can be modeled by an exponential function.
Find the equation of the least squares exponential regression curve for .
Write down the coefficient of determination, .
Interpret what the value of tells you about the model.
Hence predict the temperature of the water after 3 minutes.
A newspaper vendor in Singapore is trying to predict how many copies of The Straits Times they will sell. The vendor forms a model to predict the number of copies sold each weekday. According to this model, they expect the same number of copies will be sold each day.
To test the model, they record the number of copies sold each weekday during a particular week. This data is shown in the table.

A goodness of fit test at the significance level is used on this data to determine whether the vendor’s model is suitable. The critical value for the test is .
Find an estimate for how many copies the vendor expects to sell each day.
State the null and alternative hypotheses for this test.
Write down the degrees of freedom for this test.
Write down the conclusion to the test. Give a reason for your answer.
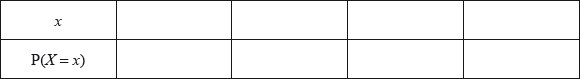
Two unbiased tetrahedral (four-sided) dice with faces labelled 1, 2, 3, 4 are thrown and the scores recorded. Let the random variable T be the maximum of these two scores.
The probability distribution of T is given in the following table.

Find the value of a and the value of b.
Find the expected value of T.
The cars for a fairground ride hold four people. They arrive at the platform for loading and unloading every seconds.
During the hour from am the arrival of people at the ride in any interval of minutes can be modelled by a Poisson distribution with a mean of .
When the am car leaves there is no one in the queue to get on the ride.
Shunsuke arrives at am.
Find the probability that more than people arrive at the ride before Shunsuke.
Find the probability there will be space for him on the car.
Chloe and Selena play a game where each have four cards showing capital letters A, B, C and D.
Chloe lays her cards face up on the table in order A, B, C, D as shown in the following diagram.

Selena shuffles her cards and lays them face down on the table. She then turns them over one by one to see if her card matches with Chloe’s card directly above.
Chloe wins if no matches occur; otherwise Selena wins.
Chloe and Selena repeat their game so that they play a total of 50 times.
Suppose the discrete random variable X represents the number of times Chloe wins.
Show that the probability that Chloe wins the game is .
Determine the mean of X.
Determine the variance of X.
A company produces bags of sugar with a labelled weight of . The weights of the bags are normally distributed with a mean of and a standard deviation of . In an inspection, if the weight of a randomly chosen bag is less than then the company fails the inspection.
Find the probability that the company fails the inspection.
A statistician in the company suggests it would be fairer if the company passes the inspection when the mean weight of five randomly chosen bags is greater than .
Find the probability of passing the inspection if the statistician’s suggestion is followed.
The discrete random variable X has the following probability distribution, where p is a constant.

Find the value of p.
Find μ, the expected value of X.
Find P(X > μ).
The sex of cuttlefish is difficult to determine visually, so it is often found by weighing the cuttlefish.
The weights of adult male cuttlefish are known to be normally distributed with mean and standard deviation .
The weights of adult female cuttlefish are known to be normally distributed with mean and standard deviation .
A zoologist uses the null hypothesis that in the absence of information a cuttlefish is male.
If the weight is found to be above the cuttlefish is classified as female.
of adult cuttlefish are male.
Find the probability of making a Type I error when weighing a male cuttlefish.
Find the probability of making a Type II error when weighing a female cuttlefish.
Find the probability of making an error using the zoologist’s method.
Consider two events, and , such that and .
By drawing a Venn diagram, or otherwise, find .
Show that the events and are not independent.
It is believed that the power of a signal at a point km from an antenna is inversely proportional to where .
The value of is recorded at distances of to and the values of and are plotted on the graph below.

The values of and are shown in the table below.

Explain why this graph indicates that is inversely proportional to .
Find the equation of the least squares regression line of against .
Use your answer to part (b) to write down the value of to the nearest integer.
Find an expression for in terms of .
The number of fish that can be caught in one hour from a particular lake can be modelled by a Poisson distribution.
The owner of the lake, Emily, states in her advertising that the average number of fish caught in an hour is three.
Tom, a keen fisherman, is not convinced and thinks it is less than three. He decides to set up the following test. Tom will fish for one hour and if he catches fewer than two fish he will reject Emily’s claim.
State a suitable null and alternative hypotheses for Tom’s test.
Find the probability of a Type I error.
The average number of fish caught in an hour is actually 2.5.
Find the probability of a Type II error.
The number of cars passing a certain point in a road was recorded during 80 equal time intervals and summarized in the table below.

Carry out a goodness of fit test at the 5% significance level to decide if the above data can be modelled by a Poisson distribution.
A zoologist believes that the number of eggs laid in the Spring by female birds of a certain breed follows a Poisson law. She observes 100 birds during this period and she produces the following table.

The zoologist wishes to determine whether or not a Poisson law provides a suitable model.
Calculate the mean number of eggs laid by these birds.
Write down appropriate hypotheses.
Carry out a test at the 1% significance level, and state your conclusion.
Product research leads a company to believe that the revenue () made by selling its goods at a price () can be modelled by the equation.
, ,
There are two competing models, A and B with different values for the parameters and .
Model A has = 3, = −0.5 and model B has = 2.5, = −0.6.
The company experiments by selling the goods at three different prices in three similar areas and the results are shown in the following table.

The company will choose the model with the smallest value for the sum of square residuals.
Determine which model the company chose.
Mr Burke teaches a mathematics class with 15 students. In this class there are 6 female students and 9 male students.
Each day Mr Burke randomly chooses one student to answer a homework question.
In the first month, Mr Burke will teach his class 20 times.
Find the probability he will choose a female student 8 times.
The Head of Year, Mrs Smith, decides to select a student at random from the year group to read the notices in assembly. There are 80 students in total in the year group. Mrs Smith calculates the probability of picking a male student 8 times in the first 20 assemblies is 0.153357 correct to 6 decimal places.
Find the number of male students in the year group.
A company sends a group of employees on a training course. Afterwards, they survey these employees to gather data on the effectiveness of the training. In order to test the reliability of the survey, they design two sets of similar questions, which are given to the employees one week apart.
The questions in the survey were grouped in different sections. The mean scores of the employees on the first section of each survey are given in the table.

State the name of this test for reliability.
State a possible disadvantage of using this test for reliability.
Calculate Pearson’s product moment correlation coefficient for this data.
Hence determine, with a reason, if the survey is reliable.
On Paul’s farm, potatoes are packed in sacks labelled . The weights of the sacks of potatoes can be modelled by a normal distribution with mean weight and standard deviation .
Find the probability that a sack is under its labelled weight.
Find the lower quartile of the weights of the sacks of potatoes.
The sacks of potatoes are transported in crates. There are sacks in each crate and the weights of the sacks of potatoes are independent of each other.
Find the probability that the total weight of the sacks of potatoes in a crate exceeds .
Observations on pairs of values of the random variables yielded the following results.
Calculate the value of , the product moment correlation coefficient of the sample.
Assuming that the distribution of is bivariate normal with product moment correlation coefficient , calculate the -value of your result when testing the hypotheses .
State whether your -value suggests that and are independent.
Given a further value from the distribution of , , predict the corresponding value of . Give your answer to one decimal place.
The continuous random variable X has a probability density function given by
.
Find the value of .
By considering the graph of f write down the mean of ;
By considering the graph of f write down the median of ;
By considering the graph of f write down the mode of .
Show that .
Hence state the interquartile range of .
Calculate .
The number of coffees sold per hour at an independent coffee shop is modelled by a Poisson distribution with a mean of coffees per hour.
Sheila, the shop’s owner wants to increase the number of coffees sold in the shop. She decides to offer a discount to customers who buy more than one coffee.
To test how successful this strategy is, Sheila records the number of coffees sold over a single -hour period. Sheila decides to use a level of significance in her test.
State the null and alternative hypotheses for the test.
Find the probability that Sheila will make a type I error in her test conclusion.
Sheila finds coffees were sold during the -hour period.
State Sheila’s conclusion to the test. Justify your answer.
The heights, metres, of the 241 new entrants to a men’s college were measured and the following statistics calculated.
The Head of Mathematics decided to use a test to determine whether or not these heights could be modelled by a normal distribution. He therefore divided the data into classes as follows.

Calculate unbiased estimates of the population mean and the population variance.
State suitable hypotheses.
Calculate the value of the statistic and state your conclusion using a 10% level of significance.
The graph below shows a small maze, in the form of a network of directed routes. The vertices to show junctions in the maze and the edges show the possible paths available from one vertex to another.
A mouse is placed at vertex and left to wander the maze freely. The routes shown by dashed lines indicate paths sprinkled with sugar.
When the mouse reaches any junction, she rests for a constant time before continuing.
At any junction, it may also be assumed that
- the mouse chooses any available normal path with equal probability
- if the junction includes a path sprinkled with sugar, the probability of choosing this path is twice that of a normal path.

Determine the transition matrix for this graph.
If the mouse was left to wander indefinitely, use your graphic display calculator to estimate the percentage of time that the mouse would spend at point .
Comment on your answer to part (b), referring to at least one limitation of the model.
Eggs at a farm are sold in boxes of six. Each egg is either brown or white. The owner believes that the number of brown eggs in a box can be modelled by a binomial distribution. He examines 100 boxes and obtains the following data.

Calculate the mean number of brown eggs in a box.
Hence estimate , the probability that a randomly chosen egg is brown.
By calculating an appropriate statistic, test, at the 5% significance level, whether or not the binomial distribution gives a good fit to these data.
Adesh wants to model the cooling of a metal rod. He heats the rod and records its temperature as it cools.

He believes the temperature can be modeled by , where .
Hence
Show that .
Find the equation of the regression line of on .
find the value of and of .
predict the temperature of the metal rod after 3 minutes.
Katie likes to cycle to work as much as possible. If Katie cycles to work one day then she has a probability of of not cycling to work on the next work day. If she does not cycle to work one day then she has a probability of of not cycling to work on the next work day.
Complete the following transition diagram to represent this information.

Katie works for days in a year.
Find the probability that Katie cycles to work on her final working day of the year.
A psychologist records the number of digits () of that a sample of IB Mathematics higher level candidates could recall.

The psychologist has read that in the general population people can remember an average of digits of . The psychologist wants to perform a statistical test to see if IB Mathematics higher level candidates can remember more digits than the general population.
is the null hypothesis for this test.
Find an unbiased estimate of the population mean of .
Find an unbiased estimate of the population variance of .
State the alternative hypothesis.
Given that all assumptions for this test are satisfied, carry out an appropriate hypothesis test. State and justify your conclusion. Use a significance level.
A manager wishes to check the mean mass of flour put into bags in his factory. He randomly samples 10 bags and finds the mean mass is 1.478 kg and the standard deviation of the sample is 0.0196 kg.
Find for this sample.
Find a 95 % confidence interval for the population mean, giving your answer to 4 significant figures.
The bags are labelled as being 1.5 kg mass. Comment on this claim with reference to your answer in part (b).
As part of the selection process for an engineering course at a particular university, applicants are given an exam in mathematics. This year the university has produced a new exam and they want to test if it is a valid indicator of future performance, before giving it to applicants. They randomly select 8 students in their first year of the engineering course and give them the exam. They compare the exam scores with their results in the engineering course.
The results of the 8 students are shown in the table.

State the name of this test for validity.
Calculate Pearson’s product moment correlation coefficient for this data.
Hence determine, with a reason, if the new exam is a valid indicator of future performance.
In a coffee shop, the time it takes to serve a customer can be modelled by a normal distribution with a mean of 1.5 minutes and a standard deviation of 0.4 minutes.
Two customers enter the shop together. They are served one at a time.
Find the probability that the total time taken to serve both customers will be less than 4 minutes.
Clearly state any assumptions you have made.
A transition matrix for a Markov chain will have the form .
Show that is always an eigenvalue for M and find the other eigenvalue in terms of and .
Find the steady state probability vector for M in terms of and .
The random variable has the Poisson distribution . Given that , find the value of in the form where is an integer.
The random variable has the Poisson distribution . Find in the form where and are integers.
A robot moves around the maze shown below.

Whenever it leaves a room it is equally likely to take any of the exits.
The time interval between the robot entering and leaving a room is the same for all transitions.
Find the transition matrix for the maze.
A scientist sets up the robot and then leaves it moving around the maze for a long period of time.
Find the probability that the robot is in room when the scientist returns.
The number of cars arriving at a junction in a particular town in any given minute between and is historically known to follow a Poisson distribution with a mean of cars per minute.
A new road is built near the town. It is claimed that the new road has decreased the number of cars arriving at the junction.
To test the claim, the number of cars, , arriving at the junction between and on a particular day will be recorded. The test will have the following hypotheses:
the mean number of cars arriving at the junction has not changed,
the mean number of cars arriving at the junction has decreased.
The alternative hypothesis will be accepted if .
Assuming the null hypothesis to be true, state the distribution of .
Find the probability of a Type I error.
Find the probability of a Type II error, if the number of cars now follows a Poisson distribution with a mean of cars per minute.
Consider two events and defined in the same sample space.
Given that and ,
Show that .
(i) show that ;
(ii) hence find .
Sue sometimes goes out for lunch. If she goes out for lunch on a particular day then the probability that she will go out for lunch on the following day is 0.4. If she does not go out for lunch on a particular day then the probability she will go out for lunch on the following day is 0.3.
Write down the transition matrix for this Markov chain.
We know that she went out for lunch on a particular Sunday, find the probability that she went out for lunch on the following Tuesday.
Find the steady state probability vector for this Markov chain.
The number of telephone calls received by a helpline over 80 one-minute periods are summarized in the table below.

Find the exact value of the mean of this distribution.
Test, at the 5% level of significance, whether or not the data can be modelled by a Poisson distribution.
The diagram below shows part of the screen from a weather forecasting website showing the data for town . The percentages on the bottom row represent the likelihood of some rain during the hour leading up to the time given. For example there is a chance (a probability of ) of rain falling on any point in town between and .

Paula works at a building site in the area covered by this page of the website from to . She has lunch from to .
In the following parts you may assume all probabilities are independent.
Paula needs to work outside between and and will also spend her lunchtime outside.
Write down the probability it rains during Paula’s lunch break.
Find the probability it will not rain while Paula is outside.
Find the probability it will rain at least once while Paula is outside.
Given it rains at least once while Paula is outside find the probability that it rains during her lunch hour.
Let be a random variable which follows a normal distribution with mean . Given that , find
.
.
George goes fishing. From experience he knows that the mean number of fish he catches per hour is . It is assumed that the number of fish he catches can be modelled by a Poisson distribution.
On a day in which George spends hours fishing, find the probability that he will catch more than fish.
The matrix has eigenvalues and .
A switch has two states, and . Each second it either remains in the same state or moves according to the following rule: If it is in state it will move to state with a probability of and if it is in state it will move to state with a probability of .
Find an eigenvector corresponding to the eigenvalue of . Give your answer in the form , where .
Using your answer to (a), or otherwise, find the long-term probability of the switch being in state . Give your answer in the form , where .
The faces of a fair six-sided die are numbered 1, 2, 2, 4, 4, 6. Let be the discrete random variable that models the score obtained when this die is rolled.
Complete the probability distribution table for .
Find the expected value of .
The strength of earthquakes is measured on the Richter magnitude scale, with values typically between and where is the most severe.
The Gutenberg–Richter equation gives the average number of earthquakes per year, , which have a magnitude of at least . For a particular region the equation is
, for some .
This region has an average of earthquakes per year with a magnitude of at least .
The equation for this region can also be written as .
Within this region the most severe earthquake recorded had a magnitude of .
The number of earthquakes in a given year with a magnitude of at least can be modelled by a Poisson distribution, with mean . The number of earthquakes in one year is independent of the number of earthquakes in any other year.
Let be the number of years between the earthquake of magnitude and the next earthquake of at least this magnitude.
Find the value of .
Find the value of .
Find the average number of earthquakes in a year with a magnitude of at least .
Find .
Find the coordinates of the point of intersection of the planes defined by the equations and .