
SL Paper 1
For a study, a researcher collected 200 leaves from oak trees. After measuring the lengths of the leaves, in cm, she produced the following cumulative frequency graph.
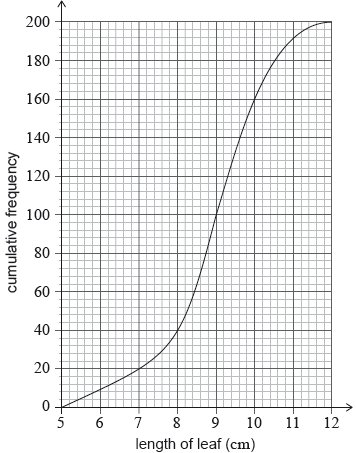
Write down the median length of these leaves.
Write down the number of leaves with a length less than or equal to 8 cm.
Markscheme
* This question is from an exam for a previous syllabus, and may contain minor differences in marking or structure.
9 (cm) (A1) (C1)
[1 mark]
40 (leaves) (A1) (C1)
[1 mark]
Examiners report
On journeys to his office, Isaac noted whether or not it rained. He also recorded his journey time to the office, and classified each journey as short, medium or long.
Of the journeys to the office, there were short journeys when it rained, medium journeys when it rained, and long journeys when it rained. There were also short journeys when it did not rain.
Isaac carried out a test at the level of significance on these data, looking at the weather and the types of journeys.
Write down , the null hypothesis for this test.
Find the expected number of short trips when it rained.
The -value for this test is .
State the conclusion to Isaac’s test. Justify your reasoning.
Markscheme
* This question is from an exam for a previous syllabus, and may contain minor differences in marking or structure.
type of journey and whether it rained are independent (A1) (C1)
Note: Accept “there is no association” or “not dependent”. Do not accept “not related” or “not correlated”. Accept equivalent terms for ‘type of journey’.
[1 mark]
OR (A1)(M1)
Note: Award (A1) for or seen. Award (M1) for OR seen.
(A1) (C3)
[3 marks]
reject (do not accept) (A1)
OR
type of journey and whether it rained are not independent (A1)
Note: Follow through from part (a) for their phrasing of the null hypothesis.
(R1) (C2)
Note: A comparison must be seen, either numerically or in words (e.g. -value < significance level). Do not award (R0)(A1).
[2 marks]
Examiners report
Each athlete on a running team recorded the distance ( miles) they ran in minutes.
The median distance is miles and the interquartile range is miles.
This information is shown in the following box-and-whisker plot.

The distance in miles, , can be converted to the distance in kilometres, , using the formula .
The variance of the distances run by the athletes is .
The standard deviation of the distances is miles.
A total of athletes from different teams compete in a race. The times the athletes took to run the race are shown in the following cumulative frequency graph.

There were athletes who took between and minutes to complete the race.
Find the value of .
Write down the value of the median distance in kilometres (km).
Find the value of .
Find .
The first athletes that completed the race won a prize.
Given that an athlete took between and minutes to complete the race, calculate the probability that they won a prize.
Markscheme
* This question is from an exam for a previous syllabus, and may contain minor differences in marking or structure.
valid approach (M1)
eg
A1 N2
[2 marks]
(km) A1 N1
[1 mark]
METHOD 1 (standard deviation first)
valid approach (M1)
eg
standard deviation (km) (A1)
valid approach to convert their standard deviation (M1)
eg
(miles) A1 N3
Note: If no working shown, award M1A1M0A0 for the value .
If working shown, and candidate’s final answer is , award M1A1M0A0.
METHOD 2 (variance first)
valid approach to convert variance (M1)
eg
variance (A1)
valid approach (M1)
eg
(miles) A1 N3
[4 marks]
correct frequency for minutes (A1)
eg
adding their frequency (do not accept ) (M1)
eg athletes
(minutes) A1 N3
[3 marks]
(minutes) (A1)
correct working (A1)
eg athletes between and minutes,
evidence of conditional probability or reduced sample space (M1)
eg
correct working (A1)
eg
A1 N5
Note: If no other working is shown, award A0A0M1A0A0 for answer of .
Award N0 for answer of with no other working shown.
[5 marks]
Examiners report
Malthouse school opens at 08:00 every morning.
The daily arrival times of the 500 students at Malthouse school follow a normal distribution. The mean arrival time is 52 minutes after the school opens and the standard deviation is 5 minutes.
Find the probability that a student, chosen at random arrives at least 60 minutes after the school opens.
Find the probability that a student, chosen at random arrives between 45 minutes and 55 minutes after the school opens.
A second school, Mulberry Park, also opens at 08:00 every morning. The arrival times of the students at this school follows exactly the same distribution as Malthouse school.
Given that, on one morning, 15 students arrive at least 60 minutes after the school opens, estimate the number of students at Mulberry Park school.
Markscheme
0.0548 (0.054799…, 5.48%) (A2) (C2)

[2 marks]
0.645 (0.6449900…, 64.5%) (A2) (C2)

[2 marks]
(M1)
Note: Award (M1) for dividing 15 by their part (a)(i).
Accept an equation of the form 15 = x × 0.0548 for (M1).
274 (273.722…) (A1)(ft) (C2)
Note: Follow through from part (a)(i). Accept 273.
[2 marks]
Examiners report
A food scientist measures the weights of potatoes taken from a single field and the distribution of the weights is shown by the cumulative frequency curve below.

Find the number of potatoes in the sample with a weight of more than grams.
Find the median weight.
Find the lower quartile.
Find the upper quartile.
The weight of the smallest potato in the sample is grams and the weight of the largest is grams.
Use the scale shown below to draw a box and whisker diagram showing the distribution of the weights of the potatoes. You may assume there are no outliers.

Markscheme
* This sample question was produced by experienced DP mathematics senior examiners to aid teachers in preparing for external assessment in the new MAA course. There may be minor differences in formatting compared to formal exam papers.
(M1)A1
[2 marks]
Median A1
[1 mark]
Lower quartile A1
[1 mark]
Upper quartile A1
[1 mark]
 M1A1
M1A1
Note: The M1 is for a box and whisker plot and the A1 for all statistics in the right places.
[2 marks]
Examiners report
Consider the following sets:
The universal set consists of all positive integers less than 15;
is the set of all numbers which are multiples of 3;
is the set of all even numbers.
Write down the elements that belong to .
Write down the elements that belong to .
Write down .
Markscheme
* This question is from an exam for a previous syllabus, and may contain minor differences in marking or structure.
= {3, 6, 9, 12} AND = {2, 4, 6, 8, 10, 12, 14} (M1)
Note: Award (M1) for listing all elements of sets and . May be seen in part (b). Condone the inclusion of 15 in set when awarding the (M1).
6, 12 (A1)(A1) (C3)
Note: Award (A1) for each correct element. Award (A1)(A0) if one additional value seen. Award (A0)(A0) if two or more additional values are seen.
[3 marks]
3, 9 (A1)(ft)(A1)(ft) (C2)
Note: Follow through from part (a) but only if their and are explicitly listed.
Award (A1)(ft) for each correct element. Award (A1)(A0) if one additional value seen. Award (A0)(A0) if two or more additional values are seen.
[2 marks]
2 (A1)(ft) (C1)
Note: Follow through from part (b)(i).
[1 mark]
Examiners report
Jim heated a liquid until it boiled. He measured the temperature of the liquid as it cooled. The following table shows its temperature, degrees Celsius, minutes after it boiled.

Jim believes that the relationship between and can be modelled by a linear regression equation.
Write down the independent variable.
Write down the boiling temperature of the liquid.
Jim describes the correlation as very strong. Circle the value below which best represents the correlation coefficient.
Jim’s model is , for . Use his model to predict the decrease in temperature for any 2 minute interval.
Markscheme
A1 N1
[1 mark]
105 A1 N1
[1 mark]
A2 N2
[2 marks]
valid approach (M1)
eg
finding where
4.48 (degrees) A1 N2
Notes: Award no marks for answers that directly use the table to find the decrease in temperature for 2 minutes eg .
[2 marks]
Examiners report
A florist sells bouquets of roses. The florist recorded, in Table 1, the number of roses in each bouquet sold to customers.
Table 1

The roses can be arranged into bouquets of size small, medium or large. The data from Table 1 has been organized into a cumulative frequency table, Table 2.
Table 2

Complete the cumulative frequency table.
Write down the probability that a bouquet of roses sold is not small.
A customer buys a large bouquet.
Find the probability that there are 12 roses in this bouquet.
Markscheme
* This question is from an exam for a previous syllabus, and may contain minor differences in marking or structure.
 (A1)(A1)(ft) (C2)
Note: Award (A1) for 10; (A1)(ft) for the last column all correct. Follow through from their 10 for their 50 in the last column.
[2 marks]
(A1)(ft)(A1)(ft) (C2)
Note: Award (A1)(ft) for their numerator being 25 + their 10, and (A1)(ft) for their denominator being their 50. Follow through from part (a).
[2 marks]
(A1)(A1)(ft) (C2)
Note: Award (A1) for a numerator of 4 and (A1)(ft) for their 10 as denominator. Follow through from part (a).
[2 marks]
Examiners report
Deb used a thermometer to record the maximum daily temperature over ten consecutive days. Her results, in degrees Celsius (), are shown below.
For this data set, find the value of
the mode.
the mean.
the standard deviation.
Markscheme
A1
[1 mark]
(M1)
A1
[2 marks]
A1
[1 mark]
Examiners report
A group of students sat a history exam. The cumulative frequency graph shows the scores obtained by the students.

The students were awarded a grade from to , depending on the score obtained in the exam. The number of students receiving each grade is shown in the following table.

The mean grade for these students is .
Find the median of the scores obtained.
Find an expression for in terms of .
Find the number of students who obtained a grade .
Find the minimum score needed to obtain a grade .
Markscheme
A1
[1 mark]
recognition that all entries add up to (M1)
OR A1
[2 marks]
(M1)(A1)
Note: Award (M1) for attempt to substitute into mean formula, LHS expression is sufficient for the M mark. Award (A1) for correct substitutions in one variable OR in two variables, followed by evidence of solving simultaneously with .
A1
[3 marks]
their part (c)(i) seen (e.g. indicated on graph) (M1)
A1
[2 marks]
Examiners report
Most candidates were able to identify the median from the cumulative frequency graph in part (a). In part (b), attention to the demand of this part of the question would have turned one mark into two for a significant number of candidates. Candidates realized that the sum of the frequencies in the table should add up to , however, some neglected to make the subject of the formula.
In part (c)(i), there were mixed results when calculating the mean from the frequency table, with some candidates using only the frequencies and not including the grades in their calculation. Division by was often seen. More able candidates, however, did manage to arrive at the required value of . In part (c)(ii) some candidates scored follow-through marks from their incorrect value for but it seemed that many candidates did not realize that they had to use the cumulative frequency graph to find the answer.
The masses of Fuji apples are normally distributed with a mean of and a standard deviation of .
When Fuji apples are picked, they are classified as small, medium, large or extra large depending on their mass. Large apples have a mass of between and .
Approximately of Fuji apples have a mass within the medium-sized category, which is between and .
Determine the probability that a Fuji apple selected at random will be a large apple.
Find the value of .
Markscheme
sketch of normal curve with shaded region to the right of the mean and correct values (M1)

A1
[2 marks]
EITHER
(A1)
(A1)
OR
(A1)
OR
OR (A1)
OR
 (A1)(A1)
Note: Award A1 for a normal distribution curve with a vertical line on each side of the mean and a correct probability of either or or shown, A1 for a probability of seen.
THEN
A1
[3 marks]
Examiners report
A straightforward calculation of probability for a normal distribution was well done.
The majority of candidates used 0.68 as the area to the left of k. Very few candidates knew how to approach the question when the probability given was not the complete area to the left or right of k.
Anne-Marie planted four sunflowers in order of height, from shortest to tallest.

Flower is tall.
The median height of the flowers is .
The range of the heights is . The height of Flower is and the height of Flower is .
The mean height of the flowers is .
Find the height of Flower .
Using this information, write down an equation in and .
Write down a second equation in and .
Using your answers to parts (b) and (c), find the height of Flower .
Using your answers to parts (b) and (c), find the height of Flower .
Markscheme
* This question is from an exam for a previous syllabus, and may contain minor differences in marking or structure.
OR OR (M1)
Note: Award (M1) for subtracting from the median, or equivalent.
(A1) (C2)
[2 marks]
(or equivalent) (A1) (C1)
[1 mark]
OR (or equvalent) (A1)(ft) (C1)
Note: Follow through from part (a).
[1 mark]
(A1)(ft) (C1)
Note: Follow through from parts (b) and (c).
[1 mark]
(A1)(ft) (C1)
Note: Follow through from parts (b) and (c).
[1 mark]
Examiners report
The marks achieved by students taking a college entrance test follow a normal distribution with mean 300 and standard deviation 100.
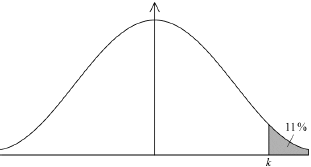
In this test, 10 % of the students achieved a mark greater than k.
Marron College accepts only those students who achieve a mark of at least 450 on the test.
Find the value of k.
Find the probability that a randomly chosen student will be accepted by Marron College.
Given that Naomi attends Marron College, find the probability that she achieved a mark of at least 500 on the test.
Markscheme
* This question is from an exam for a previous syllabus, and may contain minor differences in marking or structure.
 (M1)
(M1)
Note: Award (M1) for diagram that shows the correct shaded area and percentage, k has to be greater than the mean.
OR
Award (M1) for P(mark > k) = 0.1 or P(mark ≤ k) = 0.9 seen.
428 (428.155…) (A1) (C2)
[2 marks]
 (M1)
(M1)
Note: Award (M1) for diagram that shows the correct shaded area and the value 450 labelled to the right of the mean.
OR
Award (M1) for P(mark ≥ 450) seen.
0.0668 (0.0668072…, 6.68 %, 6.68072… %) (A1) (C2)
[2 marks]
(M1)
Note: Award (M1) for 0.0228 (0.0227500…) seen. Accept 1 − 0.97725.
= 0.341 (0.340532…, 34.1 %, 34.0532…%) (A1)(ft) (C2)
Note: Follow through from part (b), provided answer is between zero and 1.
[2 marks]
Examiners report
Ms Calhoun measures the heights of students in her mathematics class. She is interested to see if the mean height of male students, , is the same as the mean height of female students, . The information is recorded in the table.

At the 10 % level of significance, a -test was used to compare the means of the two groups. The data is assumed to be normally distributed and the standard deviations are equal between the two groups.
State the null hypothesis.
State the alternative hypothesis.
Calculate the -value for this test.
State, giving a reason, whether Ms Calhoun should accept the null hypothesis.
Markscheme
A1
Note: Accept equivalent statements in words.
[1 mark]
A1
Note: Accept equivalent statements in words.
[1 mark]
0.296 (0.295739…) A2
[2 marks]
0.296 > 0.1 R1
fail to reject the null hypothesis, there is no difference between the mean height of male and female students A1
Note: Award (R1) for a correct comparison of their -value to the test level, award (A1) for the correct interpretation from that comparison.
Do not award R0A1.
[2 marks]
Examiners report
In a school, students in grades 9 to 12 were asked to select their preferred drink. The choices were milk, juice and water. The data obtained are organized in the following table.
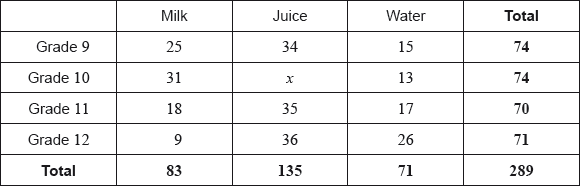
A test is carried out at the 5% significance level with hypotheses:
The critical value for this test is 12.6.
Write down the value of .
Write down the number of degrees of freedom for this test.
Use your graphic display calculator to find the statistic for this test.
State the conclusion for this test. Give a reason for your answer.
Markscheme
* This question is from an exam for a previous syllabus, and may contain minor differences in marking or structure.
30 (A1) (C1)
[1 mark]
6 (A1) (C1)
[1 mark]
(A2)(ft) (C2)
Note: Follow through from part (a).
Award (A1) for truncation to 18.9.
[2 marks]
reject (do not accept) ORaccept (A1)(ft)
Note: Can be written in words.
(R1) (C2)
Note: Accept “” for the (R1) provided their value is explicitly seen in their part (c).
OR
(R1) (C2)
Note: Do not award (R0)(A1)(ft). Follow through from part (c). Numerical comparison must be seen to award the (R1).
[2 marks]
Examiners report
A disc is divided into sectors, number to . The angles at the centre of each of the sectors form an arithmetic sequence, with being the largest angle.

It is given that .
Write down the value of .
Find the value of .
A game is played in which the arrow attached to the centre of the disc is spun and the sector in which the arrow stops is noted. If the arrow stops in sector the player wins points, otherwise they lose points.
Let be the number of points won
Find .
Markscheme
* This sample question was produced by experienced DP mathematics senior examiners to aid teachers in preparing for external assessment in the new MAA course. There may be minor differences in formatting compared to formal exam papers.
A1
[1 mark]
EITHER
M1
M1A1
OR
M1
M1
Substitute this value A1
THEN
A1
[4 marks]
M1A1
[2 marks]
Examiners report
A scientist measures the concentration of dissolved oxygen, in milligrams per litre (y) , in a river. She takes 10 readings at different temperatures, measured in degrees Celsius (x).
The results are shown in the table.

It is believed that the concentration of dissolved oxygen in the river varies linearly with the temperature.
For these data, find Pearson’s product-moment correlation coefficient, r.
For these data, find the equation of the regression line y on x.
Using the equation of the regression line, estimate the concentration of dissolved oxygen in the river when the temperature is 18 °C.
Markscheme
−0.974 (−0.973745…) (A2)
Note: Award (A1) for an answer of 0.974 (minus sign omitted). Award (A1) for an answer of −0.973 (incorrect rounding).
[2 marks]
y = −0.365x + 17.9 (y = −0.365032…x + 17.9418…) (A1)(A1) (C4)
Note: Award (A1) for −0.365x, (A1) for 17.9. Award at most (A1)(A0) if not an equation or if the values are reversed (eg y = 17.9x −0.365).
[2 marks]
y = −0.365032… × 18 + 17.9418… (M1)
Note: Award (M1) for correctly substituting 18 into their part (a)(ii).
= 11.4 (11.3712…) (A1)(ft) (C2)
Note: Follow through from part (a)(ii).
[2 marks]
Examiners report
A city hired 160 employees to work at a festival. The following cumulative frequency curve shows the number of hours employees worked during the festival.
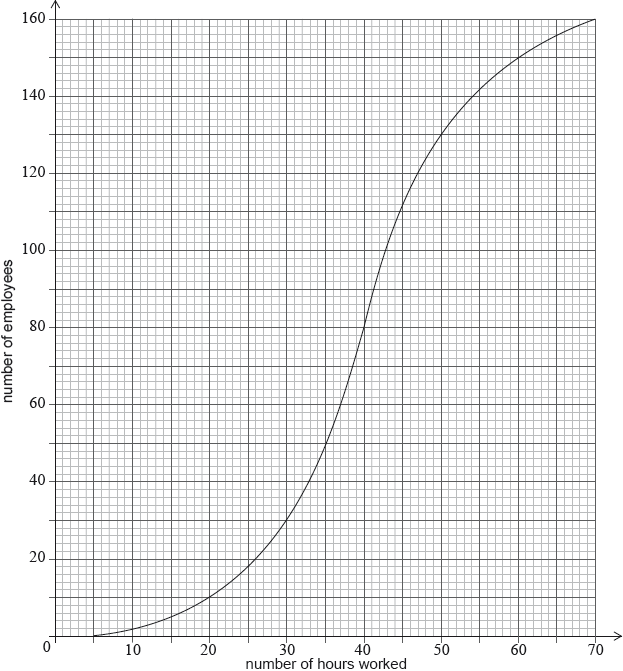
The city paid each of the employees £8 per hour for the first 40 hours worked, and £10 per hour for each hour they worked after the first 40 hours.
Write down the number of employees who worked 50 hours or less.
Find the amount of money an employee earned for working 40 hours;
Markscheme
130 employees A1 N1
[1 mark]
£320 A1 N1
[1 mark]
Examiners report
Events and are independent with and .
Find .
Find .
Markscheme
* This question is from an exam for a previous syllabus, and may contain minor differences in marking or structure.
valid interpretation (may be seen on a Venn diagram) (M1)
eg
A1 N2
[2 marks]
valid attempt to find (M1)
eg
correct working for (A1)
eg
correct working for (A1)
eg
A1 N3
[4 marks]
Examiners report
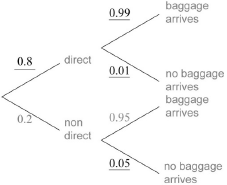
Sara regularly flies from Geneva to London. She takes either a direct flight or a non-directflight that goes via Amsterdam.
If she takes a direct flight, the probability that her baggage does not arrive in London is 0.01.
If she takes a non-direct flight the probability that her baggage arrives in London is 0.95.
The probability that she takes a non-direct flight is 0.2.

Complete the tree diagram.
Find the probability that Sara’s baggage arrives in London.
Markscheme
* This question is from an exam for a previous syllabus, and may contain minor differences in marking or structure.
 (A1)(A1)(A1) (C3)
Note: Award (A1) for each correct pair of probabilities.
[3 marks]
(A1)(ft)(M1)
Note: Award (A1)(ft) for two correct products of probabilities taken from their diagram, (M1) for the addition of their products.
(A1)(ft) (C3)
Note: Follow through from part (a).
[3 marks]
Examiners report
Consider the following Venn diagrams.

Write down an expression, in set notation, for the shaded region represented by Diagram 1.
Write down an expression, in set notation, for the shaded region represented by Diagram 2.
Write down an expression, in set notation, for the shaded region represented by Diagram 3.
Shade, on the Venn diagram, the region represented by the set .

Shade, on the Venn diagram, the region represented by the set .

Markscheme
A' (A1)
Note: Accept alternative set notation for complement such as U − A.
[1 mark]
OR (A1)
Note: Accept alternative set notation for complement.
[1 mark]
OR (A2) (C4)
Note: Accept equivalent answers, for example .
[2 marks]
 (A1)
(A1)
[1 mark]
 (A1) (C2)
[1 mark]
Examiners report
The following Venn diagram shows the events and , where . The values shown are probabilities.

Find the value of .
Find the value of .
Find .
Markscheme
* This question is from an exam for a previous syllabus, and may contain minor differences in marking or structure.
valid approach (M1)
eg 0.30 − 0.1, + 0.1 = 0.3
= 0.2 A1 N2
[2 marks]
valid approach (M1)
eg 1 − (0.3 + 0.4), 1 − 0.4 − 0.1 −
= 0.3 A1 N2
[2 marks]
valid approach (M1)
eg , , ,

A1 N2
[2 marks]
Examiners report
The random variable is normally distributed with a mean of 100. The following diagram shows the normal curve for .
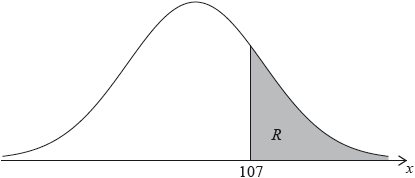
Let be the shaded region under the curve, to the right of 107. The area of is 0.24.
Write down .
Find .
Find .
Markscheme
* This question is from an exam for a previous syllabus, and may contain minor differences in marking or structure.
A1 N1
[1 mark]
valid approach (M1)
eg
correct working (A1)
eg
A1 N2
[3 marks]
valid approach (M1)
eg
A1 N2
[2 marks]
Examiners report
A bag contains 5 red and 3 blue discs, all identical except for the colour. First, Priyanka takes a disc at random from the bag and then Jorgé takes a disc at random from the bag.
Complete the tree diagram.

Find the probability that Jorgé chooses a red disc.
Markscheme
* This question is from an exam for a previous syllabus, and may contain minor differences in marking or structure.
 (A1)(A1)(A1) (C3)
Note: Award (A1) for each correct pair of branches.
[3 marks]
(A1)(ft)(M1)
Note: Award (A1)(ft) for their two correct products from their tree diagram. Follow through from part (a), award (M1) for adding their two products. Award (M0) if additional products or terms are added.
= (A1)(ft) (C3)
Note: Follow through from their tree diagram, only if probabilities are [0,1].
[3 marks]
Examiners report
Srinivasa places the nine labelled balls shown below into a box.

Srinivasa then chooses two balls at random, one at a time, from the box. The first ball is not replaced before he chooses the second.
Find the probability that the first ball chosen is labelled .
Find the probability that the first ball chosen is labelled or labelled .
Find the probability that the second ball chosen is labelled , given that the first ball chosen was labelled .
Find the probability that both balls chosen are labelled .
Markscheme
(A1) (C1)
[1 mark]
(A1) (C1)
[1 mark]
(A1)(A1) (C2)
Note: Award (A1) for correct numerator, (A1) for correct denominator.
[2 marks]
(M1)
Note: Award (M1) for a correct compound probability calculation seen.
(A1) (C2)
[2 marks]
Examiners report
A school consists of students divided into grade levels. The numbers of students in each grade are shown in the table below.

The Principal of the school wishes to select a sample of students. She wishes to ensure that, as closely as possible, the proportion of the students from each grade in the sample is the same as the proportions in the school.
Calculate the number of grade students who should be in the sample.
The Principal selects the students for the sample by asking those who took part in a previous survey if they would like to take part in another. She takes the first of those who reply positively, up to the maximum needed for the sample.
State which two of the sampling methods listed below best describe the method used.
Stratified Quota Convenience Systematic Simple random
Markscheme
* This sample question was produced by experienced DP mathematics senior examiners to aid teachers in preparing for external assessment in the new MAA course. There may be minor differences in formatting compared to formal exam papers.
M1(A1)
(students) A1
[3 marks]
Quota and convenience A1A1
Note: Award A1A0 for one correct and one incorrect answer.
[2 marks]
Examiners report
The water temperature in Lake Windermere is measured on the first day of eight consecutive months from January to August (months to ) and the results are shown below. The value for May (month ) has been accidently deleted.

Assuming the data follows a linear model for this period, find the regression line of on for the remaining data.
Use your line to find an estimate for the water temperature on the first day of May.
Explain why your line should not be used to estimate the value of at which the temperature is .
Explain in context why your line should not be used to predict the value for December (month ).
State a more appropriate model for the water temperature in the lake over an extended period of time. You are not expected to calculate any parameters.
Markscheme
* This sample question was produced by experienced DP mathematics senior examiners to aid teachers in preparing for external assessment in the new MAA course. There may be minor differences in formatting compared to formal exam papers.
A1A1
[2 marks]
(M1)A1
[2 marks]
Because the line should only be used to estimate from and not from . R1
[1 mark]
Because the temperatures are no longer going up at a steady rate, or because we know that winter is approaching so the temperature will go down, or temperatures are not likely to continue increasing. R1
[1 mark]
Trigonometric or sinusoidal A1
[1 mark]
Examiners report
Arriane has geese on her farm. She claims the mean weight of eggs from her black geese is less than the mean weight of eggs from her white geese.
She recorded the weights of eggs, in grams, from a random selection of geese. The data is shown in the table.

In order to test her claim, Arriane performs a -test at a level of significance. It is assumed that the weights of eggs are normally distributed and the samples have equal variances.
State, in words, the null hypothesis.
Calculate the -value for this test.
State whether the result of the test supports Arriane’s claim. Justify your reasoning.
Markscheme
EITHER
The population mean weight of eggs from (her/the) black geese is equal to/the same as the population mean weight of eggs from (her/the) white geese.
OR
The population mean weight of eggs from (her/the) black geese is not less than the population mean weight of eggs from (her/the) white geese. A1
Note: Reference to the "population mean weight" must be explicit for the A1 to be awarded. The term “population” can be implied by use of “all” or “on average” or “generally” when relating to the weight of eggs e.g. “the mean weight of eggs for all (her/the) black geese”.
Award A0 if reference is made to the mean weights from the sample or the table.
Award A0 for a null hypothesis written in symbolic form.
[1 mark]
-value A2
Note: Award A1 for an answer of , from “unpooled” settings on GDC.
[2 marks]
R1
(insufficient evidence to reject )
Arriane’s claim is not supported by the evidence A1
Note: Accept or significance level provided is explicitly seen in part (b). Award A1 only if reference is specifically made to Arriane's claim.
Do not award R0A1.
[2 marks]
Examiners report
Andre will play in the semi-final of a tennis tournament.
If Andre wins the semi-final he will progress to the final. If Andre loses the semi-final, he will not progress to the final.
If Andre wins the final, he will be the champion.
The probability that Andre will win the semi-final is . If Andre wins the semi-final, then the probability he will be the champion is .
The probability that Andre will not be the champion is .
Complete the values in the tree diagram.

Find the value of .
Given that Andre did not become the champion, find the probability that he lost in the semi-final.
Markscheme
* This question is from an exam for a previous syllabus, and may contain minor differences in marking or structure.
 (A1) (C1)
Note: Award (A1) for the correct pair of probabilities.
[1 mark]
(M1)
Note: Award (M1) for multiplying and adding correct probabilities for losing equated to .
OR
(M1)
Note: Award (M1) for multiplying correct probabilities for winning equated to or .
(A1)(ft) (C2)
Note: Follow through from their part (a). Award the final (A1)(ft) only if their is within the range .
[2 marks]
(A1)(ft)(A1)
Note: Award (A1)(ft) for their correct numerator. Follow through from part (b). Award (A1) for the correct denominator.
OR
(A1)(ft)(A1)(ft)
Note: Award (A1)(ft) for their correct numerator. Follow through from part (b). Award (A1)(ft) for their correct calculation of Andre losing the semi-final or winning the semi-final and then losing in the final. Follow through from their parts (a) and (b).
(A1)(ft) (C3)
Note: Follow through from parts (a) and (b).
[3 marks]
Examiners report
A newspaper vendor in Singapore is trying to predict how many copies of The Straits Times they will sell. The vendor forms a model to predict the number of copies sold each weekday. According to this model, they expect the same number of copies will be sold each day.
To test the model, they record the number of copies sold each weekday during a particular week. This data is shown in the table.

A goodness of fit test at the significance level is used on this data to determine whether the vendor’s model is suitable.
The critical value for the test is and the hypotheses are
The data satisfies the model.
The data does not satisfy the model.
Find an estimate for how many copies the vendor expects to sell each day.
Write down the degrees of freedom for this test.
Write down the conclusion to the test. Give a reason for your answer.
Markscheme
A1
[1 mark]
A1
[1 mark]
OR -value A2
OR R1
therefore there is insufficient evidence to reject A1
(i.e. the data satisfies the model)
Note: Do not award R0A1. Accept “accept” or “do not reject” in place of “insufficient evidence to reject”.
Award the R1 for comparing their -value with or their value with and then FT their final conclusion.
[4 marks]
Examiners report
In a city, of people have blue eyes. If someone has blue eyes, the probability that they also have fair hair is . This information is represented in the following tree diagram.

It is known that of people in this city have fair hair.
Calculate the value of
Write down the value of .
Find an expression, in terms of , for the probability of a person not having blue eyes and having fair hair.
.
.
Markscheme
A1
[1 mark]
A1
[1 mark]
(M1)
Note: Award (M1) for setting up equation for fair-haired or equivalent.
A1
[2 marks]
A1
[1 mark]
Examiners report
Despite its position on the paper, this probability question was reasonably well attempted by most candidates. Many candidates were able to score at least the first mark and the final FT mark. Even the weaker candidates recognized that probabilities added to in part (c)(ii). Parts (b) and (c)(i) seemed to be the most difficult part for the less able candidates.
Despite its position on the paper, this probability question was reasonably well attempted by most candidates. Many candidates were able to score at least the first mark and the final FT mark. Even the weaker candidates recognized that probabilities added to in part (c)(ii). Parts (b) and (c)(i) seemed to be the most difficult part for the less able candidates.
Despite its position on the paper, this probability question was reasonably well attempted by most candidates. Many candidates were able to score at least the first mark and the final FT mark. Even the weaker candidates recognized that probabilities added to in part (c)(ii). Parts (b) and (c)(i) seemed to be the most difficult part for the less able candidates.
Despite its position on the paper, this probability question was reasonably well attempted by most candidates. Many candidates were able to score at least the first mark and the final FT mark. Even the weaker candidates recognized that probabilities added to in part (c)(ii). Parts (b) and (c)(i) seemed to be the most difficult part for the less able candidates.
A bag contains marbles, two of which are blue. Hayley plays a game in which she randomly draws marbles out of the bag, one after another, without replacement. The game ends when Hayley draws a blue marble.
Let = 5. Find the probability that the game will end on her
Find the probability, in terms of , that the game will end on her first draw.
Find the probability, in terms of , that the game will end on her second draw.
third draw.
fourth draw.
Hayley plays the game when = 5. She pays $20 to play and can earn money back depending on the number of draws it takes to obtain a blue marble. She earns no money back if she obtains a blue marble on her first draw. Let M be the amount of money that she earns back playing the game. This information is shown in the following table.

Find the value of so that this is a fair game.
Markscheme
A1 N1
[1 mark]
correct probability for one of the draws A1
eg P(not blue first) = , blue second =
valid approach (M1)
eg recognizing loss on first in order to win on second, P(B' then B), P(B') × P(B | B'), tree diagram
correct expression in terms of A1 N3
eg , ,
[3 marks]
correct working (A1)
eg
A1 N2
[2 marks]
correct working (A1)
eg
A1 N2
[2 marks]
correct probabilities (seen anywhere) (A1)(A1)
eg , (may be seen on tree diagram)
valid approach to find E (M) or expected winnings using their probabilities (M1)
eg ,
correct working to find E (M) or expected winnings (A1)
eg ,
correct equation for fair game A1
eg ,
correct working to combine terms in (A1)
eg , ,
= 5 A1 N0
Note: Do not award the final A1 if the candidate’s FT probabilities do not sum to 1.
[7 marks]
Examiners report
Karl has three brown socks and four black socks in his drawer. He takes two socks at random from the drawer.
Complete the tree diagram.

Find the probability that Karl takes two socks of the same colour.
Given that Karl has two socks of the same colour find the probability that he has two brown socks.
Markscheme
 A1
A1
Note: Award A1 for both missing probabilities correct.
[1 mark]
multiplying along branches and then adding outcomes (M1)
A1
[2 marks]
use of conditional probability formula M1
A1
A1
[3 marks]
Examiners report
(a) It was pleasing to see that, for those candidates who made a reasonable attempt at the paper, many were able to identify the correct values on the tree diagram.
(b) Many identified at least one correct branch. Some who identified both correct branches and the respective probabilities failed to add their results.
(c) Some candidates identified conditional probability evidenced by dividing a probability by their previous answer.
Many identified at least one correct branch. Some who identified both correct branches and the respective probabilities failed to add their results.
Some candidates identified conditional probability evidenced by dividing a probability by their previous answer.
Charles wants to measure the strength of the relationship between the price of a house and its distance from the city centre where he lives. He chooses houses of a similar size and plots a graph of price, (in thousands of dollars) against distance from the city centre, (km).

The data from the graph is shown in the table.

Explain why it is not appropriate to use Pearson’s product moment correlation coefficient to measure the strength of the relationship between and .
Explain why it is appropriate to use Spearman’s rank correlation coefficient to measure the strength of the relationship between and .
Calculate Spearman’s rank correlation coefficient for this data.
State what conclusion Charles can make from the answer in part (c).
Markscheme
the data is not linear R1
[1 mark]
the data is (montonically) decreasing. R1
[1 mark]
assign ranks M1
average equal prices M1
 A1A1
A1A1
(Note: condone ) A2
[6 marks]
There is a strong, negative relationship between the price of a house and its distance from the city centre. R1
[1 mark]
Examiners report
Mr Burke teaches a mathematics class with 15 students. In this class there are 6 female students and 9 male students.
Each day Mr Burke randomly chooses one student to answer a homework question.
In the first month, Mr Burke will teach his class 20 times.
Find the probability that on any given day Mr Burke chooses a female student to answer a question.
Find the probability he will choose a female student 8 times.
Find the probability he will choose a male student at most 9 times.
Markscheme
A1
[1 mark]
P(X = 8) (M1)
Note: Award (M1) for evidence of recognizing binomial probability. eg P(X = 8), X ∼ B.
0.180 (0.179705…) A1
[2 marks]
P(male) = A1
P(X ≤ 9) = 0.128 (0.127521…) (M1)A1
Note: Award (M1) for evidence of correct approach eg, P(X ≤ 9).
[3 marks]
Examiners report
A set of data comprises of five numbers which have been placed in ascending order.
Recalling definitions, such as the Lower Quartile is the piece of data with the data placed in order, find an expression for the Interquartile Range.
Hence, show that a data set with only 5 numbers in it cannot have any outliers.
Give an example of a set of data with 7 numbers in it that does have an outlier, justify this fact by stating the Interquartile Range.
Markscheme
M1A1
[2 marks]
M1A1
Since due to the ascending order. R1
Similarly M1A1
Since due to the ascending order.
So there are no outliers for a data set of 5 numbers. AG
[5 marks]
For example 1, 2, 3, 4, 5, 6, 100 where A1A1
[2 marks]
Examiners report
A calculator generates a random sequence of digits. A sample of 200 digits is randomly selected from the first 100 000 digits of the sequence. The following table gives the number of times each digit occurs in this sample.

It is claimed that all digits have the same probability of appearing in the sequence.
Test this claim at the 5% level of significance.
Explain what is meant by the 5% level of significance.
Markscheme
H0: The sequence contains equal numbers of each digit. (A1)
H1: The sequence does not contain equal numbers of each digit. (A1)
(M1)(A1)
The number of degrees of freedom is 9. (A1)
(A1)
. Hence H0 is accepted. (A1)
[7 marks]
The probability of rejecting H0 when it is true (A1)
is 0.05. (A1)
Note: Award (A1)(A1) for “the probability of a type I error is 0.05.”
[2 marks]
Examiners report
Each month the number of days of rain in Cardiff is recorded.
The following data was collected over a period of 10 months.
11 13 8 11 8 7 8 14 x 15
For these data the median number of days of rain per month is 10.
Find the value of x.
Find the standard deviation
Find the interquartile range.
Markscheme
* This question is from an exam for a previous syllabus, and may contain minor differences in marking or structure.
(M1)
Note: Award (M1) for correct substitution into median formula or for arranging all 9 values into ascending/descending order.
(A1) (C2)
[2 marks]
2.69 (2.69072…) (A2)(ft)
Note: Follow through from part (a).
[2 marks]
13 − 8 (M1)
Note: Award (M1) for 13 and 8 seen.
= 5 (A1)(ft) (C4)
Note: Follow through from part (a).
[2 marks]
Examiners report
On a work day, the probability that Mr Van Winkel wakes up early is .
If he wakes up early, the probability that he is on time for work is .
If he wakes up late, the probability that he is on time for work is .
The probability that Mr Van Winkel arrives on time for work is .
Complete the tree diagram below.
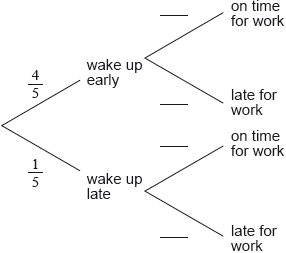
Find the value of .
Markscheme
* This question is from an exam for a previous syllabus, and may contain minor differences in marking or structure.
 (A1)(A1) (C2)
Note: Award (A1) for each correct pair of probabilities.
[2 marks]
(A1)(ft)(M1)(M1)
Note: Award (A1)(ft) for two correct products from part (a), (M1) for adding their products, (M1) for equating the sum of any two probabilities to .
(A1)(ft) (C4)
Note: Award the final (A1)(ft) only if . Follow through from part (a).
[4 marks]
Examiners report
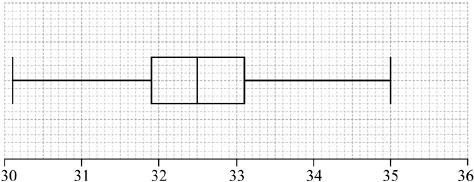
A sample of 120 oranges was tested for Vitamin C content. The cumulative frequency curve below represents the Vitamin C content, in milligrams, of these oranges.

The minimum level of Vitamin C content of an orange in the sample was 30.1 milligrams. The maximum level of Vitamin C content of an orange in the sample was 35.0 milligrams.
Draw a box-and-whisker diagram on the grid below to represent the Vitamin C content, in milligrams, for this sample.

Markscheme
Note: Award (A1)(ft) for correct median, (A1)(ft) for correct quartiles and box, (A1) for correct end points of whiskers and straight whiskers.
Award at most (A1)(A1)(A0) if a horizontal line goes right through the box or if the whiskers are not well aligned with the midpoint of the box.
Follow through from part (a).
[3 marks]
Examiners report
University students were surveyed and asked how many hours, , they worked each month. The results are shown in the following table.

Use the table to find the following values.
The first five class intervals, indicated in the table, have been used to draw part of a cumulative frequency curve as shown.

.
.
On the same grid, complete the cumulative frequency curve for these data.
Use the cumulative frequency curve to find an estimate for the number of students who worked at most 35 hours per month.
Markscheme
(A1) (C1)
Note: Award (A1) for each correct value.
[1 mark]
(A1) (C1)
Note: Award (A1) for each correct value.
[1 mark]
 (A1)(A1) (C2)
Note: Award (A1)(ft) for their 3 correctly plotted points; award (A1)(ft) for completing diagram with a smooth curve through their points. The second (A1)(ft) can follow through from incorrect points, provided the gradient of the curve is never negative. Award (C2) for a completely correct smooth curve that goes through the correct points.
[2 marks]
a straight vertical line drawn at 35 (accept 35 ± 1) (M1)
26 (students) (A1) (C2)
Note: Accept values between 25 and 27 inclusive.
[2 marks]
Examiners report
Applicants for a job had to complete a mathematics test. The time they took to complete the test is normally distributed with a mean of 53 minutes and a standard deviation of 16.3. One of the applicants is chosen at random.
For 11% of the applicants it took longer than minutes to complete the test.
There were 400 applicants for the job.
Find the probability that this applicant took at least 40 minutes to complete the test.
Find the value of .
Estimate the number of applicants who completed the test in less than 25 minutes.
Markscheme
* This question is from an exam for a previous syllabus, and may contain minor differences in marking or structure.
0.787 (0.787433…, 78.7%) (M1)(A1) (C2)
Note: Award (M1) for a correct probability statement, , or a correctly shaded normal distribution graph.
[2 marks]
73.0 (minutes) (72.9924…) (M1)(A1) (C2)
Note: Award (M1) for a correct probability statement, , or a correctly shaded normal distribution graph.
[2 marks]
(M1)
Note: Award (M1) for multiplying a probability by 400. Do not award (M1) for .
Use of a lower bound less than zero gives a probability of 0.0429172….
(A1) (C2)
Notes: Accept a final answer of 17. Do not accept a final answer of 18. Accept a non-integer final answer either 16.9 (16.9373…) from use of lower bound zero or 17.2 (17.1669…) from use of the default lower bound of .
[2 marks]
Examiners report
Eduardo believes that there is a linear relationship between the age of a male runner and the time it takes them to run metres.
To test this, he recorded the age, years, and the time, minutes, for eight males in a single race. His results are presented in the following table and scatter diagram.

Eduardo looked in a sports science text book. He found that the following information about was appropriate for athletic performance.

For this data, find the value of the Pearson’s product-moment correlation coefficient, .
Comment on your answer to part (a), using the information that Eduardo found.
Write down the equation of the regression line of on , in the form .
A 57-year-old male also ran in the race.
Use the equation of the regression line to estimate the time he took to complete the race.
Markscheme
A2
[2 marks]
strong A1
Note: Answer may include “positive”, however this is not necessary for the mark.
[1 mark]
A1
Note: Condone in place of . Answer must be an equation.
[1 mark]
(M1)
Note: Award (M1) for correct substitution into their regression line.
A1
Note: Accept and from use of sf and/or sf values.
[2 marks]
Examiners report
Generally, a good starting point for most candidates. Most of them could find the correlation coefficient with a correct interpretation. They could find the regression equation and use it appropriately to make a prediction. It was observed that candidates used a mixture of two and three significant figures to reach an answer. Marks were generally awarded for their correct three significant answers or answers given to a higher degree of accuracy. The weaker candidates substituted instead of years into their equation.
Generally, a good starting point for most candidates. Most of them could find the correlation coefficient with a correct interpretation. They could find the regression equation and use it appropriately to make a prediction. It was observed that candidates used a mixture of two and three significant figures to reach an answer. Marks were generally awarded for their correct three significant answers or answers given to a higher degree of accuracy. The weaker candidates substituted instead of years into their equation.
Generally, a good starting point for most candidates. Most of them could find the correlation coefficient with a correct interpretation. They could find the regression equation and use it appropriately to make a prediction. It was observed that candidates used a mixture of two and three significant figures to reach an answer. Marks were generally awarded for their correct three significant answers or answers given to a higher degree of accuracy. The weaker candidates substituted instead of years into their equation.
Generally, a good starting point for most candidates. Most of them could find the correlation coefficient with a correct interpretation. They could find the regression equation and use it appropriately to make a prediction. It was observed that candidates used a mixture of two and three significant figures to reach an answer. Marks were generally awarded for their correct three significant answers or answers given to a higher degree of accuracy. The weaker candidates substituted instead of years into their equation.
Chicken eggs are classified by grade (, , , or ), based on weight. A mixed carton contains eggs and could include eggs from any grade. As part of the science project, Rocky buys mixed cartons and sorts the eggs according to their weight.

State whether the weight of the eggs is a continuous or discrete variable.
Write down the modal grade of the eggs.
Use your graphic display calculator to find an estimate for the standard deviation of the weight of the eggs.
The mean weight of these eggs is 64.9 grams, correct to three significant figures.
Use the table and your answer to part (c) to find the smallest possible number of eggs that could be within one standard deviation of the mean.
Markscheme
continuous (A1) (C1)
[1 mark]
(A1) (C1)
Note: Award (A0) for an answer of .
[1 mark]
(g) (A2) (C2)
[2 marks]
OR (M1)
Note: Award (M1) for correct endpoints seen. If the answer to part (c) is , award (M1) for endpoints of .
(A1)(ft) (C2)
Note: Follow through from their part (c). For a standard deviation between and inclusive, the FT answer is .
[2 marks]
Examiners report
Leo is investigating whether a six-sided die is fair. He rolls the die times and records the observed frequencies in the following table:

Leo carries out a goodness of fit test at a significance level.
Write down the null and alternative hypotheses.
Write down the degrees of freedom.
Write down the expected frequency of rolling a .
Find the -value for the test.
State the conclusion of the test. Give a reason for your answer.
Markscheme
The die is fair OR OR probabilities are equal
The die is not fair OR OR probabilities are not equal A1
[1 mark]
A1
[1 mark]
A1
[1 mark]
(-value ) A2
[2 marks]
R1
EITHER
Insufficient evidence to reject the null hypothesis A1
OR
Insufficient evidence to reject that the die is fair A1
Note: Do not award R0A1. Condone “accept the null hypothesis” or “the die is fair”. Their conclusion must be consistent with their -value and their hypothesis.
[2 marks]
Examiners report
Many candidates confused this goodness of fit question with a χ2 test for independence and so incorrect statements for the hypotheses were seen frequently.
Many candidates stated the degrees of freedom correctly.
Expected value was not well understood. The most popular but erroneous answer was where the candidate calculated .
Some confusion between the required -value and the χ2 value. In the case of the latter, no further marks were available for this question. Too many candidates wrote down a value with .
Comparing their -value with 0.05 or 5% correctly earned a mark for reasoning. Obtaining the reasoning mark enabled even those candidates with incorrect hypotheses in part (a), to be credited the final mark provided the conclusion was clear.
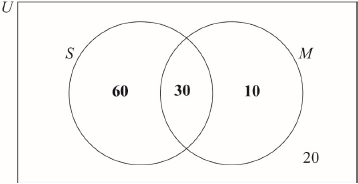
Rosewood College has 120 students. The students can join the sports club () and the music club ().
For a student chosen at random from these 120, the probability that they joined both clubs is and the probability that they joined the music club is.
There are 20 students that did not join either club.
Complete the Venn diagram for these students.

One of the students who joined the sports club is chosen at random. Find the probability that this student joined both clubs.
Determine whether the events and are independent.
Markscheme
* This question is from an exam for a previous syllabus, and may contain minor differences in marking or structure.
 (A1)(A1) (C2)
Note: Award (A1) for 30 in correct area, (A1) for 60 and 10 in the correct areas.
[2 marks]
(A1)(ft)(A1)(ft) (C2)
Note: Award (A1)(ft) for correct numerator of 30, (A1)(ft) for correct denominator of 90. Follow through from their Venn diagram.
[2 marks]
(R1)
Note: Award (R1) for multiplying their by .
therefore the events are independent (A1)(ft) (C2)
Note: Award (R1)(A1)(ft) for an answer which is consistent with their Venn diagram.
Do not award (R0)(A1)(ft).
Do not award final (A1) if is not calculated. Follow through from part (a).
[2 marks]
Examiners report
A random variable Z is normally distributed with mean 0 and standard deviation 1. It is known that P( < −1.6) = and P( > 2.4) = . This is shown in the following diagram.

A second random variable is normally distributed with mean and standard deviation .
It is known that P( < 1) = .
Find P(−1.6 < < 2.4). Write your answer in terms of and .
Given that > −1.6, find the probability that z < 2.4 . Write your answer in terms of and .
Write down the standardized value for .
It is also known that P( > 2) = .
Find .
Markscheme
* This question is from an exam for a previous syllabus, and may contain minor differences in marking or structure.
recognizing area under curve = 1 (M1)
eg , ,
A1 N2
[2 marks]
(seen anywhere) (A1)
recognizing conditional probability (M1)
eg ,
correct working (A1)
eg ,
A1 N4
Note: Do not award the final A1 if correct answer is seen followed by incorrect simplification.
[4 marks]
(may be seen in part (d)) A1 N1
Note: Depending on the candidate’s interpretation of the question, they may give as the answer to part (c). Such answers should be awarded the first (M1) in part (d), even when part (d) is left blank. If the candidate goes on to show as part of their working in part (d), the A1 in part (c) may be awarded.
[1 mark]
attempt to standardize (do not accept ) (M1)
eg (may be seen in part (c)), ,
correct equation with each -value (A1)(A1)
eg , ,
valid approach (to set up equation in one variable) M1
eg ,
correct working (A1)
eg , ,
A1 N2
[6 marks]
Examiners report
The following scatter diagram shows the scores obtained by seven students in their mathematics test, m, and their physics test, p.

The mean point, M, for these data is (40, 16).
Plot and label the point M on the scatter diagram.
Draw the line of best fit, by eye, on the scatter diagram.
Using your line of best fit, estimate the physics test score for a student with a score of 20 in their mathematics test.
Markscheme
* This question is from an exam for a previous syllabus, and may contain minor differences in marking or structure.
 (A1)(A1) (C2)
Note: Award (A1) for mean point plotted and (A1) for labelled M.
[2 marks]
straight line through their mean point crossing the p-axis at 5±2 (A1)(ft)(A1)(ft) (C2)
Note: Award (A1)(ft) for a straight line through their mean point. Award (A1)(ft) for a correct p-intercept if line is extended.
[2 marks]
point on line where m = 20 identified and an attempt to identify y-coordinate (M1)
10.5 (A1)(ft) (C2)
Note: Follow through from their line in part (b).
[2 marks]
Examiners report
Sungwon plays a game where she rolls a fair -sided die and spins a fair spinner with equal sectors. During each turn in the game, the die is rolled once and the spinner is spun once. The score for each turn is the sum of the two results. For example, on the die and on the spinner would receive a score of .

The following diagram represents the sample space.

Sungwon takes a second turn.
Find the probability that Sungwon’s score on her first turn is greater than .
Find the probability that Sungwon scores greater than on both of her first two turns.
Sungwon will play the game for turns.
Find the expected number of times the score on a turn is greater than .
Markscheme
(A1)(A1) (C2)
Note: Award (A1) for correct numerator, (A1) for correct denominator.
[2 marks]
(M1)
Note: Award (M1) for the square of their probability in part (a).
(A1)(ft) (C2)
Note: Follow through from part (a), provided their answer is less than or equal to .
[2 marks]
(M1)
Note: Award (M1) for multiplying their part (a) by .
(A1)(ft) (C2)
Note: Follow through from part (a), provided their answer is less than or equal to .
[2 marks]
Examiners report
In an international competition, participants can answer questions in only one of the three following languages: Portuguese, Mandarin or Hindi. 80 participants took part in the competition. The number of participants answering in Portuguese, Mandarin or Hindi is shown in the table.

A boy is chosen at random.
State the number of boys who answered questions in Portuguese.
Find the probability that the boy answered questions in Hindi.
Two girls are selected at random.
Calculate the probability that one girl answered questions in Mandarin and the other answered questions in Hindi.
Markscheme
* This question is from an exam for a previous syllabus, and may contain minor differences in marking or structure.
20 (A1) (C1)
[1 mark]
null (A1)(A1) (C2)
Note: Award (A1) for correct numerator, (A1) for correct denominator.
[2 marks]
(A1)(M1)
Note: Award (A1) for first or second correct product seen, (M1) for adding their two products or for multiplying their product by two.
(A1) (C3)
[3 marks]
Examiners report
The diagram below shows part of the screen from a weather forecasting website showing the data for town . The percentages on the bottom row represent the likelihood of some rain during the hour leading up to the time given. For example there is a chance (a probability of ) of rain falling on any point in town between and .

Paula works at a building site in the area covered by this page of the website from to . She has lunch from to .
In the following parts you may assume all probabilities are independent.
Paula needs to work outside between and .
Paula will also spend her lunchtime outside.
Write down the probability it rains during Paula’s lunch break.
Find the probability it will rain in each of the three hours Paula is working outside.
Find the probability it will not rain while Paula is outside.
Find the probability it will rain at least once while Paula is outside.
Markscheme
* This sample question was produced by experienced DP mathematics senior examiners to aid teachers in preparing for external assessment in the new MAA course. There may be minor differences in formatting compared to formal exam papers.
Note: Accept probabilities written as percentages throughout.
A1
[1 mark]
Note: Accept probabilities written as percentages throughout.
(M1)
A1
[2 marks]
Note: Accept probabilities written as percentages throughout.
(M1)
A1
[2 marks]
Note: Accept probabilities written as percentages throughout.
(M1)
A1
[2 marks]
Examiners report
Let the universal set, , be the set of all integers such that ≤ < .
, and are subsets of .
Write down .
Complete the following Venn diagram using all elements of .

Write down an element that belongs to .
Markscheme
(A1) (C1)
[1 mark]
 (A1)(A1)(A1)(A1) (C4)
Note: Award (A1) for in the correct place. Award (A1) for , , and in the correct places. Award (A1) for , , , in the correct places. Award (A1) for outside of the three circles and not shown in the diagram.
If any entry is duplicated within its region, award at most (A3).
[4 marks]
9 (A1)(ft) (C1)
Note: Award (A1) for the correct element. Follow through from their Venn diagram in part (b). Award (A0) if additional incorrect elements are included in their answer.
[1 mark]
Examiners report
A factory produces bags of sugar with a labelled weight of . The weights of the bags are normally distributed with a mean of and a standard deviation of .
A bag that weighs less than is rejected by the factory for being underweight.
Write down the percentage of bags that weigh more than .
Find the probability that a randomly chosen bag is rejected for being underweight.
A bag that weighs more than grams is rejected by the factory for being overweight. The factory rejects of bags for being overweight.
Find the value of .
Markscheme
A1
Note: Do not accept or .
[1 mark]
A2
[2 marks]
OR (M1)
Note: Award (M1) for a sketch with correct region identified.
A2
[3 marks]
Examiners report
Many candidates made no attempt at this question, suggesting poor preparation, although it has appeared frequently in past sessions.
Few candidates recognized that a normal distribution is symmetric.
Of the few candidates who were able to interpret the question correctly and use their calculator to identify the numerical digits satisfying the probability requirements, a number were out by a factor of 10.
Few correct answers were seen. Of those that tried to show a diagram, there was often not enough detail to award a method mark (e.g. the shaded area was numerically identified as 2%).
The following box-and-whisker plot shows the number of text messages sent by students in a school on a particular day.

Find the value of the interquartile range.
One student sent k text messages, where k > 11 . Given that k is an outlier, find the least value of k.
Markscheme
* This question is from an exam for a previous syllabus, and may contain minor differences in marking or structure.
recognizing Q1 or Q3 (seen anywhere) (M1)
eg 4,11 , indicated on diagram
IQR = 7 A1 N2
[2 marks]
recognizing the need to find 1.5 IQR (M1)
eg 1.5 × IQR, 1.5 × 7
valid approach to find k (M1)
eg 10.5 + 11, 1.5 × IQR + Q3
21.5 (A1)
k = 22 A1 N3
Note: If no working shown, award N2 for an answer of 21.5.
[4 marks]
Examiners report
A school café sells three flavours of smoothies: mango (), kiwi fruit () and banana ().
85 students were surveyed about which of these three flavours they like.
35 students liked mango, 37 liked banana, and 26 liked kiwi fruit
2 liked all three flavours
20 liked both mango and banana
14 liked mango and kiwi fruit
3 liked banana and kiwi fruit
Using the given information, complete the following Venn diagram.

Find the number of surveyed students who did not like any of the three flavours.
A student is chosen at random from the surveyed students.
Find the probability that this student likes kiwi fruit smoothies given that they like mango smoothies.
Markscheme
* This question is from an exam for a previous syllabus, and may contain minor differences in marking or structure.
 (A1)(A1) (C2)
Note: Award (A1) for 18, 12 and 1 in correct place on Venn diagram, (A1) for 3, 16 and 11 in correct place on Venn diagram.
[2 marks]
85 − (3 + 16 + 11 + 18 + 12 + 1 + 2) (M1)
Note: Award (M1) for subtracting the sum of their values from 85.
22 (A1)(ft) (C2)
Note: Follow through from their Venn diagram in part (a).
If any numbers that are being subtracted are negative award (M1)(A0).
[2 marks]
(A1)(ft)(A1)(ft) (C2)
Note: Award (A1) for correct numerator; (A1) for correct denominator. Follow through from their Venn diagram.
[2 marks]
Examiners report
Hafizah harvested mangoes from her farm. The weights of the mangoes, , in grams, are shown in the following grouped frequency table.

Write down the modal group for these data.
Use your graphic display calculator to find an estimate of the standard deviation of the weights of mangoes from this harvest.
On the grid below, draw a histogram for the data in the table.

Markscheme
* This question is from an exam for a previous syllabus, and may contain minor differences in marking or structure.
(A1) (C1)
Note: Accept alternative notation or
Do not accept "".
[1 mark]
(A2) (C2)
Note: Award (A1)(A0) for an answer of .
[2 marks]
 (A2)(A1) (C3)
Note: Award (A2) for all correct heights of bars or (A1) for three or four correct heights of bars.
Award (A1) for rectangular bars all with correct left and right end points ( and ) and for no gaps; the bars do not have to be shaded.
Award at most (A2)(A0) if a ruler is not used for all lines.
[3 marks]
Examiners report
Give your answers to four significant figures.
A die is thrown 120 times with the following results.

Showing all steps clearly, test whether the die is fair
(i) at the 5% level of significance;
(ii) at the 1% level of significance.
Explain what is meant by “level of significance” in part (a).
Markscheme
The data can be described by the following table
 (A1)
(A1)
(C1)
(A1)
(i) (A1)
Hence, since 11.3 > 11.07 at the 5% level we must accept H1. (R1)
(ii) (A1)
Hence, since 11.3 < 15.086, at the 1% level, there is not enough evidence to conclude that the die is not fair (and hence we accept H0). (R1)
[7 marks]
Let denote the significance level. If is greater than then it means that the probability of obtaining the results obtained is less than if H0 is correct. (R3)
Note: Award (R3) for any correct explanation. Use discretion to award (R2) or (R1).
[3 marks]
Examiners report
The histogram shows the time, t, in minutes, that it takes the customers of a restaurant to eat their lunch on one particular day. Each customer took less than 25 minutes.
The histogram is incomplete, and only shows data for 0 ≤ t < 20.

The mean time it took all customers to eat their lunch was estimated to be 12 minutes.
It was found that k customers took between 20 and 25 minutes to eat their lunch.
Write down the mid-interval value for 10 ≤ t < 15.
Write down the total number of customers in terms of k.
Markscheme
* This question is from an exam for a previous syllabus, and may contain minor differences in marking or structure.
12.5 (A1) (C1)
[1 mark]
33 + k OR 10 + 8 + 5 + 10 + k (A1)
Note: Award (A1) for “number of customers = 33 + k”.
[1 mark]
Examiners report
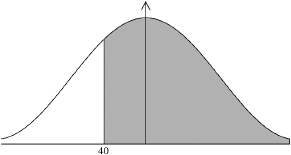
Consider the following graphs of normal distributions.

At an airport, the weights of suitcases (in kg) were measured. The weights are normally distributed with a mean of 20 kg and standard deviation of 3.5 kg.
In the following table, write down the letter of the corresponding graph next to the given mean and standard deviation.

Find the probability that a suitcase weighs less than 15 kg.
Any suitcase that weighs more than kg is identified as excess baggage.
19.6 % of the suitcases at this airport are identified as excess baggage.
Find the value of .
Markscheme
* This question is from an exam for a previous syllabus, and may contain minor differences in marking or structure.
 (A1)(A1) (C2)
Note: Award (A1) for each correct entry.
[2 marks]
 (M1)
(M1)
Note: Award (M1) for sketch with 15 labelled and left tail shaded OR for a correct probability statement, P(X < 15).
0.0766 (0.0765637…, 7.66%) (A1) (C2)
[2 marks]
 (M1)
(M1)
Note: Award (M1) for a sketch showing correctly shaded region to the right of the mean with 19.6% labelled (accept shading of the complement with 80.4% labelled) OR for a correct probability statement, P(X > ) = 0.196 or P(X ≤ ) = 0.804.
23.0 (kg) (22.9959… (kg)) (A1) (C2)
[2 marks]
Examiners report
A tetrahedral (four-sided) die has written on it the numbers 1, 2, 3 and 4. The die is rolled many times and the scores are noted. The table below shows the resulting frequency distribution.
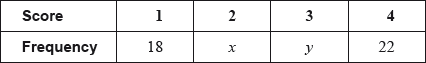
The die was rolled a total of 100 times.
The mean score is 2.71.
Write down an equation, in terms of and , for the total number of times the die was rolled.
Using the mean score, write down a second equation in terms of and .
Find the value of and of .
Markscheme
* This question is from an exam for a previous syllabus, and may contain minor differences in marking or structure.
or equivalent (A1) (C1)
[1 mark]
or equivalent (M1)(A1) (C2)
Note: Award (M1) for a sum including and , divided by 100 and equated to 2.71, (A1) for a correct equation.
[2 marks]
and (M1)
Note: Award (M1) for obtaining a correct linear equation in one variable from their (a) and their (b).
This may be implied if seen in part (a) or part (b).
(A1)(ft)(A1)(ft) (C3)
Notes: Follow through from parts (a) and (b), irrespective of working seen provided the answers are positive integers.
[3 marks]
Examiners report
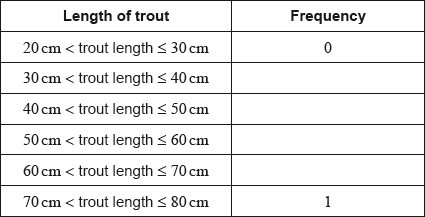
The lengths of trout in a fisherman’s catch were recorded over one month, and are represented in the following histogram.
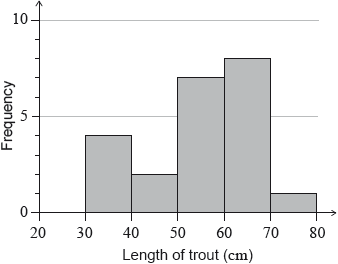
Complete the following table.
Markscheme
* This question is from an exam for a previous syllabus, and may contain minor differences in marking or structure.
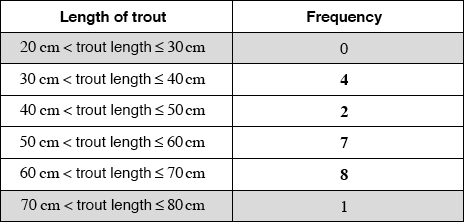 (A2) (C2)
Note: Award (A2) for all correct entries, (A1) for 3 correct entries.
[2 marks]
Examiners report
A study was conducted to investigate whether the mean reaction time of drivers who are talking on mobile phones is the same as the mean reaction time of drivers who are talking to passengers in the vehicle. Two independent groups were randomly selected for the study.
To gather data, each driver was put in a car simulator and asked to either talk on a mobile phone or talk to a passenger. Each driver was instructed to apply the brakes as soon as they saw a red light appear in front of the car. The reaction times of the drivers, in seconds, were recorded, as shown in the following table.

At the level of significance, a -test was used to compare the mean reaction times of the two groups. Each data set is assumed to be normally distributed, and the population variances are assumed to be the same.
Let and be the population means for the two groups. The null hypothesis for this test is .
State the alternative hypothesis.
Calculate the -value for this test.
State the conclusion of the test. Justify your answer.
State what your conclusion means in context.
Markscheme
A1
Note: Accept an equivalent statement in words, however reference to “population mean” must be explicit for A1 to be awarded.
[1 mark]
A2
Note: Award A1 for an answer of from not using a pooled estimate of the variance.
[2 marks]
R1
reject the null hypothesis A1
Note: Do not award R0A1.
[2 marks]
there is (significant evidence of) a difference between the (population) mean reaction times A1
Note: Their conclusion in (c)(ii) must match their conclusion in (c)(i) to earn A1. Award A0 if their conclusion refers to mean reaction times in the sample.
[1 mark]
Examiners report
Candidates who attempted to write the alternative hypothesis symbolically were successful. Those who tried to write in words generally did not make it clear whether they were referring to “population mean” and hence, were unsuccessful.
Several candidates gave the p-value from not using a pooled estimate of the variance. As stated in the Mathematics: application & interpretation guide to the syllabus, for the t-test, candidates should assume that the variance of the two groups is equal and therefore, the pooled two-sample t-test should be used.
The justification and generic conclusion were well done. However, candidates struggled when attempting to write their conclusion in context, generally referring to the reaction times rather than the mean reaction times. The conclusions were often vague as to whether the candidates were referring to the population means or the sample means; hypothesis testing is a good example on where candidates need to work to improve the clarity of their writing.
The Home Shine factory produces light bulbs, 7% of which are found to be defective.
Francesco buys two light bulbs produced by Home Shine.
The Bright Light factory also produces light bulbs. The probability that a light bulb produced by Bright Light is not defective is .
Deborah buys three light bulbs produced by Bright Light.
Write down the probability that a light bulb produced by Home Shine is not defective.
Find the probability that both light bulbs are not defective.
Find the probability that at least one of Francesco’s light bulbs is defective.
Write down an expression, in terms of , for the probability that at least one of Deborah’s three light bulbs is defective.
Markscheme
* This question is from an exam for a previous syllabus, and may contain minor differences in marking or structure.
0.93 (93%) (A1) (C1)
[1 mark]
(M1)
Note: Award (M1) for squaring their answer to part (a).
0.865 (0.8649; 86.5%) (A1)(ft) (C2)
Notes: Follow through from part (a).
Accept .
[2 marks]
(M1)
Note: Follow through from their answer to part (b)(i).
OR
(M1)
Note: Follow through from part (a).
0.135 (0.1351; 13.5%) (A1)(ft) (C2)
[2 marks]
(A1) (C1)
Note: Accept or equivalent.
[1 mark]
Examiners report
A quadratic function can be written in the form . The graph of has axis of symmetry and -intercept at
Find the value of .
Find the value of .
The line is a tangent to the curve of . Find the values of .
Markscheme
* This question is from an exam for a previous syllabus, and may contain minor differences in marking or structure.
METHOD 1 (using x-intercept)
determining that 3 is an -intercept (M1)
eg, 
valid approach (M1)
eg
A1 N2
METHOD 2 (expanding f (x))
correct expansion (accept absence of ) (A1)
eg
valid approach involving equation of axis of symmetry (M1)
eg
A1 N2
METHOD 3 (using derivative)
correct derivative (accept absence of ) (A1)
eg
valid approach (M1)
eg
A1 N2
[3 marks]
attempt to substitute (M1)
eg
correct working (A1)
eg
A1 N2
[3 marks]
METHOD 1 (using discriminant)
recognizing tangent intersects curve once (M1)
recognizing one solution when discriminant = 0 M1
attempt to set up equation (M1)
eg
rearranging their equation to equal zero (M1)
eg
correct discriminant (if seen explicitly, not just in quadratic formula) A1
eg
correct working (A1)
eg
A1A1 N0
METHOD 2 (using derivatives)
attempt to set up equation (M1)
eg
recognizing derivative/slope are equal (M1)
eg
correct derivative of (A1)
eg
attempt to set up equation in terms of either or M1
eg
rearranging their equation to equal zero (M1)
eg
correct working (A1)
eg
A1A1 N0
[8 marks]
Examiners report
The following diagram shows the graph of , the derivative of .

The graph of has a local minimum at A, a local maximum at B and passes through .
The point lies on the graph of the function, .
Write down the gradient of the curve of at P.
Find the equation of the normal to the curve of at P.
Determine the concavity of the graph of when and justify your answer.
Markscheme
A1 N1
[1 mark]
gradient of normal (A1)
attempt to substitute their normal gradient and coordinates of P (in any order) (M1)
eg
A1 N3
[3 marks]
correct answer and valid reasoning A2 N2
answer: eg graph of is concave up, concavity is positive (between )
reason: eg slope of is positive, is increasing, ,
sign chart (must clearly be for and show A and B)
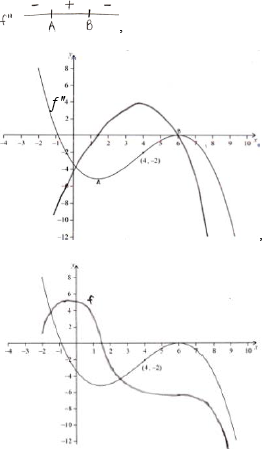
Note: The reason given must refer to a specific function/graph. Referring to “the graph” or “it” is not sufficient.
[2 marks]
Examiners report
Galois Airways has flights from Hong Kong International Airport to different destinations. The following table shows the distance, kilometres, between Hong Kong and the different destinations and the corresponding airfare, , in Hong Kong dollars (HKD).

The Pearson’s product–moment correlation coefficient for this data is , correct to three significant figures.
The distance from Hong Kong to Tokyo is km.
Use your graphic display calculator to find the equation of the regression line on .
Use your regression equation to estimate the cost of a flight from Hong Kong to Tokyo with Galois Airways.
Explain why it is valid to use the regression equation to estimate the airfare between Hong Kong and Tokyo.
Markscheme
(A1)(A1) (C2)
Note: Award (A1) for , (A1) for . If the answer is not given as an equation, award a maximum of (A1)(A0).
[2 marks]
(M1)
Note: Award (M1) for substitution into their regression equation.
(, ) (HKD) (A1)(ft) (C2)
Note: Follow through from part (a).
[2 marks]
the correlation is (very) strong (R1)
(km) is within the given data range (interpolation) (R1) (C2)
Note: Two correct reasons are required for the awarding of (C2).
[2 marks]
Examiners report
The weights of apples on a tree can be modelled by a normal distribution with a mean of grams and a standard deviation of grams.
A sample of apples are taken from trees, and , in different parts of the orchard.
The data is shown in the table below.

The owner of the orchard wants to know whether the mean weight of the apples from tree is greater than the mean weight of the apples from tree so sets up the following test:
and
Find the probability that an apple from the tree has a weight greater than grams.
Find the -value for the owner’s test.
The test is performed at the significance level.
State the conclusion of the test, giving a reason for your answer.
Markscheme
* This sample question was produced by experienced DP mathematics senior examiners to aid teachers in preparing for external assessment in the new MAA course. There may be minor differences in formatting compared to formal exam papers.
Let the weight of an apple be
(M1)A1
[2 marks]
-value (M1)A1
[2 marks]
R1
Sufficient evidence to reject the null hypothesis (that the weights of apples from the two trees are equal) A1
[2 marks]
Examiners report
A hospital collected data from 1000 patients in four hospital wards to review the quality of its healthcare. The data, showing the number of patients who became infected during their stay in hospital, was recorded in the following table.

A -test was performed at the 5% significance level.
The critical value for this test is 7.815.
The null hypothesis for the test is
: Becoming infected during a stay in the hospital is independent of the ward.
Find the expected frequency of the patients who became infected whilst in Nightingale ward.
For this test, write down the statistic.
State, giving a reason, whether the null hypothesis should be rejected.
Markscheme
* This question is from an exam for a previous syllabus, and may contain minor differences in marking or structure.
OR (M1)
(A1) (C2)
[2 marks]
8.21 (8.21497…) (A2) (C2)
[2 marks]
should be rejected (A1)(ft)
OR (the -value) (R1) (C2)
Note: Follow through from part (b). Do not award (A1)(R0).
Award (A1)(ft) for “ should be rejected” OR “Becoming infected during a stay in hospital is not independent of (is dependent on OR associated with) the ward”. Accept “Do not accept ” OR “YES”. Do not accept “Becoming infected during a stay in hospital is correlated (related OR linked) with the ward.”
Award (R1) for comparison of their statistic value from part (b) with the critical value OR a comparison of -value with 0.05.
[2 marks]
Examiners report
In a class of students, play tennis, play both tennis and volleyball, and do not play either sport.
The following Venn diagram shows the events “plays tennis” and “plays volleyball”. The values and represent numbers of students.

Find the value of .
Find the value of .
Find the probability that a randomly selected student from the class plays tennis or volleyball, but not both.
Markscheme
valid approach to find (M1)
eg
(may be seen on Venn diagram) A1 N2
[2 marks]
valid approach to find (M1)
eg
(may be seen on Venn diagram) A1 N2
[2 marks]
valid approach (M1)
eg , students, , 
A1 N2
[2 marks]
Examiners report
A group of applicants applied for admission into either the Arts programme or the Sciences programme at a university. The outcomes of their applications are shown in the following table.

An applicant is chosen at random from this group. It is found that they were accepted into the programme of their choice.
Find the probability that a randomly chosen applicant from this group was accepted by the university.
Find the probability that the applicant applied for the Arts programme.
Two different applicants are chosen at random from the original group.
Find the probability that both applicants applied to the Arts programme.
Markscheme
A1
[1 mark]
A1A1
Note: Award A1 for correct numerator and A1 for correct denominator.
Award A1A0 for working of if followed by an incorrect answer.
[2 marks]
A1M1
Note: Award A1 for two correct fractions seen, M1 for multiplying their fractions.
A1
[3 marks]
Examiners report
Candidates are reasonably proficient at calculating simple probabilities from a table.
Several candidates did not consider the condition, with some merely finding the probability of an applicant applying for Arts programme with no condition, some considering those who were accepted into Arts with no condition, and some finding the probability of being accepted into Arts given the condition that they applied for Arts.
Only a few candidates recognized dependent events, with most calculating as if the events were independent.
Let be an obtuse angle such that .
Let .
Find the value of .
Line passes through the origin and has a gradient of . Find the equation of .
Find the derivative of .
The following diagram shows the graph of for 0 ≤ ≤ 3. Line is a tangent to the graph of at point P.

Given that is parallel to , find the -coordinate of P.
Markscheme
* This question is from an exam for a previous syllabus, and may contain minor differences in marking or structure.
evidence of valid approach (M1)
eg sketch of triangle with sides 3 and 5,
correct working (A1)
eg missing side is 4 (may be seen in sketch), ,
A2 N4
[4 marks]
correct substitution of either gradient or origin into equation of line (A1)
(do not accept )
eg , ,
A2 N4
Note: Award A1A0 for .
[2 marks]
(seen anywhere, including answer) A1
choosing product rule (M1)
eg
correct derivatives (must be seen in a correct product rule) A1A1
eg ,
A1 N5
[5 marks]
valid approach to equate their gradients (M1)
eg , , ,
correct equation without (A1)
eg , ,
correct working (A1)
eg ,
(do not accept ) A1 N1
Note: Do not award the final A1 if additional answers are given.
[4 marks]
Examiners report
Jae Hee plays a game involving a biased six-sided die.
The faces of the die are labelled −3, −1, 0, 1, 2 and 5.
The score for the game, X, is the number which lands face up after the die is rolled.
The following table shows the probability distribution for X.

Jae Hee plays the game once.
Find the exact value of .
Calculate the expected score.
Jae Hee plays the game twice and adds the two scores together.
Find the probability Jae Hee has a total score of −3.
Markscheme
A1
[1 mark]
(M1)
Note: Award (M1) for their correct substitution into the formula for expected value.
A1
[2 marks]
(M1)(M1)
Note: Award (M1) for , award (M1) for multiplying their product by 2.
A1
[3 marks]
Examiners report
Six coins are tossed simultaneously 320 times, with the following results.

At the 5% level of significance, test the hypothesis that all the coins are fair.
Markscheme
Let H0 be the hypothesis that all coins are fair, (C1)
and let H1 be the hypothesis that not all coins are fair. (C1)
Let be the number of tails obtained, is binomially distributed. (M1)
 (A3)
(A3)
Notes: Award (A2) if one entry on the third row is incorrect. Award (A1) if two entries on the third row are incorrect. Award (A0) if three or more entries on the third row are incorrect.
(A1)
Also (A1)
Since 7.24 < 12.592, H0 cannot be rejected. (R1)
[9 marks]
Examiners report
A group of 60 sports enthusiasts visited the PyeongChang 2018 Winter Olympic games to watch a variety of sporting events.
The most popular sports were snowboarding (S), figure skating (F) and ice hockey (H).
For this group of 60 people:
4 did not watch any of the most popular sports,
x watched all three of the most popular sports,
9 watched snowboarding only,
11 watched figure skating only,
15 watched ice hockey only,
7 watched snowboarding and figure skating,
13 watched figure skating and ice hockey,
11 watched snowboarding and ice hockey.
Complete the Venn diagram using the given information.

Find the value of x.
Write down the value of .
Markscheme
* This question is from an exam for a previous syllabus, and may contain minor differences in marking or structure.
 (A1)(A1)(A1) (C3)
Note: Award (A1) for 4 in correct place.
Award (A1) for 9, 11, 15 in correct place.
Award (A1) for 7 − x, 13 − x, 11 − x in correct place.
Accept 2, 8 and 6 in place of 7 − x, 13 − x, 11 − x.
[3 marks]
(M1)
Note: Award (M1) for equating the sum of at least seven of the entries in their Venn diagram to 60.
(A1)(ft) (C2)
Note: Follow through from part (a), but only if answer is positive.
[2 marks]
34 (A1)(ft) (C1)
Note: Follow through from their Venn diagram.
[1 mark]
Examiners report
All the children in a summer camp play at least one sport, from a choice of football () or basketball (). 15 children play both sports.
The number of children who play only football is double the number of children who play only basketball.
Let be the number of children who play only football.
There are 120 children in the summer camp.
Write down an expression, in terms of , for the number of children who play only basketball.
Complete the Venn diagram using the above information.

Find the number of children who play only football.
Write down the value of .
Markscheme
* This question is from an exam for a previous syllabus, and may contain minor differences in marking or structure.
(A1) (C1)
[1 mark]
 (A1)(A1)(ft) (C2)
Notes: Award (A1) for 15 placed in the correct position, award (A1)(ft) for and their placed in the correct positions of diagram. Do not penalize the absence of 0 inside the rectangle and award at most (A1)(A0) if any value other than 0 is seen outside the circles. Award at most (A1)(A0) if 35 and 70 are seen instead of and their .
[2 marks]
or equivalent (M1)
Note: Award (M1) for adding the values in their Venn and equating to 120 (or equivalent).
(A1)(ft) (C2)
Note: Follow through from their Venn diagram, but only if the answer is a positive integer and is seen in their Venn diagram.
[2 marks]
85 (A1)(ft) (C1)
Note: Follow through from their Venn diagram and their answer to part (c), but only if the answer is a positive integer and less than 120.
[1 mark]
Examiners report
Abhinav carries out a χ2 test at the 1 % significance level to determine whether a person’s gender impacts their chosen professional field: engineering, medicine or law.
He surveyed 220 people and the results are shown in the table.

State the null hypothesis, H0, for this test.
Calculate the expected number of male engineers.
Find the p-value for this test.
Abhinav rejects H0.
State a reason why Abhinav is incorrect in doing so.
Markscheme
* This question is from an exam for a previous syllabus, and may contain minor differences in marking or structure.
gender and chosen profession are independent (A1) (C1)
Note: Accept there is no association between chosen profession and gender. Accept “not dependent”. Do not accept “not related” or “not correlated” or “not influenced”, or “does not impact”.
[1 mark]
(M1)
Note: Award (M1) for correct substitution into expectation formula.
= 45 (A1) (C2)
[2 marks]
0.0193 (0.0192644…) (A2) (C2)
[2 marks]
0.0193 > 0.01 (1%) (A1)(ft)
OR
the p-value is greater than the significance level (1%) (A1)(ft) (C1)
Note: A numerical value in (c) must be seen to award the (A1)(ft). Follow through from part (c), only if it is > 0.01.
Accept a correct answer from comparing both the numerical value of the Χ2 statistic and the numerical value of the critical value: 7.89898… < 9.21.
[1 mark]
Examiners report
A survey was carried out to investigate the relationship between a person’s age in years ( ) and the number of hours they watch television per week (). The scatter diagram represents the results of the survey.

The mean age of the people surveyed was 50.
For these results, the equation of the regression line on is .
Find the mean number of hours that the people surveyed watch television per week.
Draw the regression line on the scatter diagram.
By placing a tick (✔) in the correct box, determine which of the following statements is true:
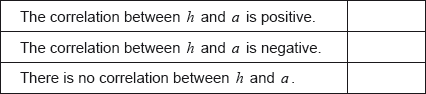
Diogo is 18 years old. Give a reason why the regression line should not be used to estimate the number of hours Diogo watches television per week.
Markscheme
* This question is from an exam for a previous syllabus, and may contain minor differences in marking or structure.
(M1)
Note: Award (M1) for correct substitution of 50 into equation of the regression line.
(A1) (C2)
OR
(M1)
Note: Award (M1) for correctly summing the values of the points, and dividing by 25.
(A1) (C2)
[2 marks]
line through and (A1)(ft)(A1) (C2)
Note: Award (A1)(ft) for a straight line through (50, their ), and (A1) for the line intercepting the -axis at ; this may need to be extrapolated. Follow through from part (a). Award at most (A0)(A1) if the line is not drawn with a ruler.
[2 marks]
 (A1) (C1)
Note: Award (A0) if more than one tick (✔) is seen.
[1 mark]
18 is less than the lowest age in the survey OR extrapolation. (A1) (C1)
Note: Accept equivalent statements.
[1 mark]
Examiners report
The number of sick days taken by each employee in a company during a year was recorded. The data was organized in a box and whisker diagram as shown below:

For this data, write down
the minimum number of sick days taken during the year.
the lower quartile.
the median.
Paul claims that this box and whisker diagram can be used to infer that the percentage of employees who took fewer than six sick days is smaller than the percentage of employees who took more than eleven sick days.
State whether Paul is correct. Justify your answer.
Markscheme
A1
[1 mark]
A1
[1 mark]
A1
[1 mark]
EITHER
Each of these percentages represent approximately of the employees. R1
OR
The diagram is not explicit enough to show what is happening at the quartiles regarding and / we do not have the data points R1
OR
Discrete data not clear how to interpret “fewer”. R1
THEN
Hence, Paul is not correct (OR no such inference can be made). A1
Note: Do not award R0A1.
[2 marks]
Examiners report
Place the numbers and in the correct position on the Venn diagram.

In the table indicate which two of the given statements are true by placing a tick (✔) in the right hand column.

Markscheme
* This question is from an exam for a previous syllabus, and may contain minor differences in marking or structure.
 (A1)(A1)(A1)(A1) (C4)
Note: Award (A1) for each number in the correct position.
[4 marks]
 (A1)(A1) (C2)
Note: Award (A1) for each correctly placed tick.
[2 marks]
Examiners report
Pablo drives to work. The probability that he leaves home before 07:00 is .
If he leaves home before 07:00 the probability he will be late for work is .
If he leaves home at 07:00 or later the probability he will be late for work is .
Copy and complete the following tree diagram.

Find the probability that Pablo leaves home before 07:00 and is late for work.
Find the probability that Pablo is late for work.
Given that Pablo is late for work, find the probability that he left home before 07:00.
Two days next week Pablo will drive to work. Find the probability that he will be late at least once.
Markscheme
* This question is from an exam for a previous syllabus, and may contain minor differences in marking or structure.
 A1A1A1 N3
Note: Award A1 for each bold fraction.
[3 marks]
multiplying along correct branches (A1)
eg
P(leaves before 07:00 ∩ late) = A1 N2
[2 marks]
multiplying along other “late” branch (M1)
eg
adding probabilities of two mutually exclusive late paths (A1)
eg
A1 N2
[3 marks]
recognizing conditional probability (seen anywhere) (M1)
eg
correct substitution of their values into formula (A1)
eg
A1 N2
[3 marks]
valid approach (M1)
eg 1 − P(not late twice), P(late once) + P(late twice)
correct working (A1)
eg
A1 N2
[3 marks]
Examiners report
Anita is concerned that the construction of a new factory will have an adverse affect on the fish in a nearby lake. Before construction begins she catches fish at random, records their weight and returns them to the lake. After the construction is finished she collects a second, random sample of weights of fish from the lake. Her data is shown in the table.

Anita decides to use a t-test, at the 5% significance level, to determine if the mean weight of the fish changed after construction of the factory.
State an assumption that Anita is making, in order to use a t-test.
State the hypotheses for this t-test.
Find the p-value for this t-test.
State the conclusion of this test, in context, giving a reason.
Markscheme
EITHER
The weights of the fish are distributed normally. A1
OR
The variance of the two groups of fish is equal. A1
[1 mark]
and A1
where B and A represent the weights before and after.
[1 mark]
df = 14, t = 0.861 (M1)
p-value = 0.403 A2
[3 marks]
Since 0.403 > 0.05 R1
Do not reject H0.
There is insufficient evidence, at the 5% level, of a change in weight. A1
[2 marks]
Examiners report
A bag contains 5 green balls and 3 white balls. Two balls are selected at random without replacement.
Complete the following tree diagram.

Find the probability that exactly one of the selected balls is green.
Markscheme
* This question is from an exam for a previous syllabus, and may contain minor differences in marking or structure.
correct probabilities
 A1A1A1 N3
Note: Award A1 for each correct bold answer.
[3 marks]
multiplying along branches (M1)
eg
adding probabilities of correct mutually exclusive paths (A1)
eg
A1 N2
[3 marks]
Examiners report
A game is played where two unbiased dice are rolled and the score in the game is the greater of the two numbers shown. If the two numbers are the same, then the score in the game is the number shown on one of the dice. A diagram showing the possible outcomes is given below.

Let be the random variable “the score in a game”.
Find the probability that
Complete the table to show the probability distribution of .

a player scores at least in a game.
a player scores , given that they scored at least .
Find the expected score of a game.
Markscheme
 A2
A2
Note: Award A1 if three to five probabilities are correct.
[2 marks]
(A1)
[1 mark]
use of conditional probability (M1)
e.g. denominator of OR denominator of , etc.
A1
[2 marks]
(M1)
A1
[2 marks]
Examiners report
Let . Part of the graph of is shown in the following diagram.

The graph of crosses the -axis at the point P. The line L is tangent to the graph of at P.
Find the coordinates of P.
Find .
Hence, find the equation of L in terms of .
The graph of has a local minimum at the point Q. The line L passes through Q.
Find the value of .
Markscheme
* This question is from an exam for a previous syllabus, and may contain minor differences in marking or structure.
valid approach (M1)
eg , , ,
(0, 6) (accept = 0 and = 6) A1 N2
[2 marks]
A2 N2
[2 marks]
valid approach (M1)
eg
correct working (A1)
eg , slope = ,
attempt to substitute gradient and coordinates into linear equation (M1)
eg , , , L
correct equation A1 N3
eg , ,
[4 marks]
valid approach to find intersection (M1)
eg
correct equation (A1)
eg
correct working (A1)
eg ,
at Q (A1)
valid approach to find minimum (M1)
eg
correct equation (A1)
eg
substitution of their value of at Q into their equation (M1)
eg ,
= −4 A1 N0
[8 marks]
Examiners report
Dune Canyon High School organizes its school year into three trimesters: fall/autumn (), winter () and spring (). The school offers a variety of sporting activities during and outside the school year.
The activities offered by the school are summarized in the following Venn diagram.
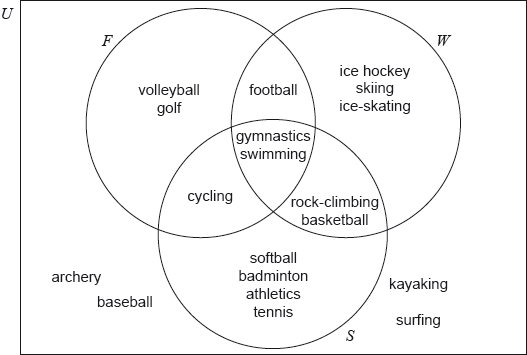
Write down the number of sporting activities offered by the school during its school year.
Determine whether rock-climbing is offered by the school in the fall/autumn trimester.
Write down the elements of the set ;
Write down .
Write down, in terms of , and , an expression for the set which contains only archery, baseball, kayaking and surfing.
Markscheme
* This question is from an exam for a previous syllabus, and may contain minor differences in marking or structure.
15 (A1) (C1)
[1 mark]
no (A1) (C1)
Note: Accept “it is only offered in Winter and Spring”.
[1 mark]
volleyball, golf, cycling (A1) (C1)
Note: Responses must list all three sports for the (A1) to be awarded.
[1 mark]
4 (A1) (C1)
[1 mark]
OR (or equivalent) (A2) (C2)
[2 marks]
Examiners report
The Malthouse Charity Run is a kilometre race. The time taken for each runner to complete the race was recorded. The data was found to be normally distributed with a mean time of minutes and a standard deviation of minutes.
A runner who completed the race is chosen at random.
Write down the probability that the runner completed the race in more than minutes.
Calculate the probability that the runner completed the race in less than minutes.
It is known that of the runners took more than minutes and less than minutes to complete the race.
Find the value of .
Markscheme
(A1) (C1)
[1 mark]
(M1)
Note: Award (M1) for a correct mathematical statement.
OR
Award (M1) for a diagram that shows the value labelled to the left of the mean and the correct shaded region.

(A1) (C2)
[2 marks]
OR (seen) (A1)
Note: Award (A1) for or seen.
OR (M1)
Note: Award (M1) for a correct mathematical statement.
OR
Award (M1) for a diagram that shows greater than the mean and shading in the region below , above , or between and the mean.

(minutes) (A1) (C3)
Note: Accept “ minutes and seconds” or (from sf value) “ minutes and seconds”.
[3 marks]
Examiners report
In an effort to study the level of intelligence of students entering college, a psychologist collected data from 4000 students who were given a standard test. The predictive norms for this particular test were computed from a very large population of scores having a normal distribution with mean 100 and standard deviation of 10. The psychologist wishes to determine whether the 4000 test scores he obtained also came from a normal distribution with mean 100 and standard deviation 10. He prepared the following table (expected frequencies are rounded to the nearest integer):

Copy and complete the table, showing how you arrived at your answers.
Test the hypothesis at the 5% level of significance.
Markscheme
To calculate expected frequencies, we multiply 4000 by the probability of each cell:
(M1)
Therefore, the expected frequency (M1)
(A1)
Similarly:
Frequency
(A1)
And
Frequency
(A1)
[5 marks]
To test the goodness of fit of the normal distribution, we use the distribution. Since the last cell has an expected frequency less than 5, it is combined with the cell preceding it. There are therefore 7 – 1 = 6 degrees of freedom. (C1)
(M1)
= 53.03 (A1)
H0: Distribution is Normal with and .
H1: Distribution is not Normal with and . (M1)
Since , we reject H0 (A1)
Or use of p-value
Therefore, we have enough evidence to suggest that the normal distribution with mean 100 and standard deviation 10 does not fit the data well. (R1)
Note: If a candidate has not combined the last 2 cells, award (C0)(M1)(A0)(M1)(A1)(R1) (or as appropriate).
[6 marks]
Examiners report
The mass of a certain type of Chilean corncob follows a normal distribution with a mean of 400 grams and a standard deviation of 50 grams.
A farmer labels one of these corncobs as premium if its mass is greater than grams. 25% of these corncobs are labelled as premium.
Write down the probability that the mass of one of these corncobs is greater than 400 grams.
Find the value of .
Estimate the interquartile range of the distribution.
Markscheme
* This question is from an exam for a previous syllabus, and may contain minor differences in marking or structure.
(A1) (C1)
[1 mark]
OR (M1)
Note: Award (M1) for a sketch of approximate normal curve with a vertical line drawn to the right of the mean with the area to the right of this line shaded.
(A1) (C2)
[2 marks]
(A1)(ft)(M1)
Note: Award (A1)(ft) for seen, award (M1) for multiplying their 33.7244… by 2. Follow through from their answer to part (b).
OR
(A1)(ft)(M1)
Note: Award (A1)(ft) for their seen, (M1) for difference between their answer to (b) and their 366.
OR
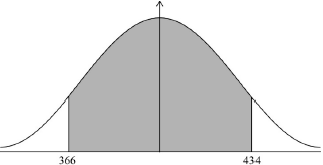 (A1)(ft)(M1)
Note: Award (A1)(ft) for their seen. Award (M1) for correct symmetrical region indicated on labelled normal curve.
67.4 (g) (A1)(ft) (C3)
Note: Accept an answer of 68 from use of rounded values. Follow through from part (b).
[3 marks]
Examiners report
A polygraph test is used to determine whether people are telling the truth or not, but it is not completely accurate. When a person tells the truth, they have a chance of failing the test. Each test outcome is independent of any previous test outcome.
people take a polygraph test and all tell the truth.
Calculate the expected number of people who will pass this polygraph test.
Calculate the probability that exactly people will fail this polygraph test.
Determine the probability that fewer than people will pass this polygraph test.
Markscheme
(M1)
(people) A1
[2 marks]
recognition of binomial probability (M1)
A1
[2 marks]
and seen OR and seen (A1)
attempt to use binomial probability (M1)
A1
[3 marks]
Examiners report
Calculating expected value was well done, with some finding the probability of passing first and then multiplying by 10, while others calculated the expected number who would fail and then subtracted from 10.
There were some candidates who did not recognize binomial probability, and attempted to calculate probability using other methods. For the candidates who did recognize binomial probability, part (b) was well done with most selecting correct calculator entries for the probability. In part (c), there was some confusion as to what value to use in their binomial cumulative distribution function for “less than 7”, with the most common error being the use of 7 rather than 6 as the parameter in the calculation.
The price per kilogram of tomatoes, in euro, sold in various markets in a city is found to be normally distributed with a mean of 3.22 and a standard deviation of 0.84.
On the following diagram, shade the region representing the probability that the price of a kilogram of tomatoes, chosen at random, will be higher than 3.22 euro.

Find the price that is two standard deviations above the mean price.
Find the probability that the price of a kilogram of tomatoes, chosen at random, will be between 2.00 and 3.00 euro.
To stimulate reasonable pricing, the city offers a free permit to the sellers whose price of a kilogram of tomatoes is in the lowest 20 %.
Find the highest price that a seller can charge and still receive a free permit.
Markscheme
 (A1) (C1)
Note: Award (A1) for vertical line drawn at the mean (3.22 does not have to be seen) and correct region shaded.
[1 mark]
4.90 (A1) (C1)
[1 mark]
0.323 (0.323499…; 32.3 %) (A2) (C2)
Note: If final answer is incorrect, (M1)(A0) may be awarded for correct shaded area shown on a sketch, below, or for a correct probability statement “P(2 ≤ ≤ 3)” (accept other variables for or “price” and strict inequalities).

[2 marks]
2.51 (2.51303…) (A2) (C2)
Note: If final answer is incorrect, (M1)(A0) may be awarded for correct shaded area shown on a sketch, below, or for a correct probability statement “P( ≤ ) = 0.2” (accept other variables and strict inequalities).

[2 marks]
Examiners report
Consider f(x), g(x) and h(x), for x∈ where h(x) = (x).
Given that g(3) = 7 , g′ (3) = 4 and f ′ (7) = −5 , find the gradient of the normal to the curve of h at x = 3.
Markscheme
* This question is from an exam for a previous syllabus, and may contain minor differences in marking or structure.
recognizing the need to find h′ (M1)
recognizing the need to find h′ (3) (seen anywhere) (M1)
evidence of choosing chain rule (M1)
eg
correct working (A1)
eg
(A1)
evidence of taking their negative reciprocal for normal (M1)
eg
gradient of normal is A1 N4
[7 marks]
Examiners report
At Springfield University, the weights, in , of chinchilla rabbits and sable rabbits were recorded. The aim was to find out whether chinchilla rabbits are generally heavier than sable rabbits. The results obtained are summarized in the following table.

A -test is to be performed at the significance level.
Write down the null and alternative hypotheses.
Find the -value for this test.
Write down the conclusion to the test. Give a reason for your answer.
Markscheme
(let population mean for chinchilla rabbits, population mean for sable rabbits)
A1
A1
Note: Accept an equivalent statement in words, must include mean and reference to “population mean” / “mean for all chinchilla rabbits” for the first A1 to be awarded.
Do not accept an imprecise “the means are equal”.
[2 marks]
-value A2
Note: Award A1 for an answer of , from “unpooled” settings on GDC.
[2 marks]
. R1
(there is sufficient evidence to) reject (or not accept) A1
(there is sufficient evidence to suggest that chinchilla rabbits are heavier than sable rabbits)
Note: Do not award R0A1. Accept ‘accept ’.
[2 marks]
Examiners report
In a group of 20 girls, 13 take history and 8 take economics. Three girls take both history and economics, as shown in the following Venn diagram. The values and represent numbers of girls.
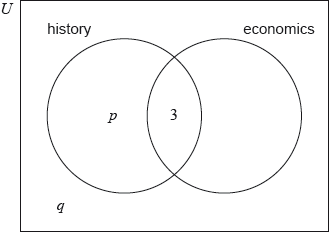
Find the value of ;
Find the value of .
A girl is selected at random. Find the probability that she takes economics but not history.
Markscheme
valid approach (M1)
eg
A1 N2
[2 marks]
valid approach (M1)
eg
A1 N2
[2 marks]
valid approach (M1)
eg
A1 N2
[2 marks]
Examiners report
The diagram shows a circular horizontal board divided into six equal sectors. The sectors are labelled white (W), yellow (Y) and blue (B).

A pointer is pinned to the centre of the board. The pointer is to be spun and when it stops the colour of the sector on which the pointer stops is recorded. The pointer is equally likely to stop on any of the six sectors.
Eva will spin the pointer twice. The following tree diagram shows all the possible outcomes.

Find the probability that both spins are yellow.
Find the probability that at least one of the spins is yellow.
Write down the probability that the second spin is yellow, given that the first spin is blue.
Markscheme
* This question is from an exam for a previous syllabus, and may contain minor differences in marking or structure.
OR (M1)
Note: Award (M1) for multiplying correct probabilities.
(0.111, 0.111111…, 11.1%) (A1) (C2)
[2 marks]
(M1)(M1)
Note: Award (M1) for and or equivalent, and (M1) for and adding only the three correct probabilities.
OR
(M1)(M1)
Note: Award (M1) for seen and (M1) for subtracting from 1. This may be shown in a tree diagram with “yellow” and “not yellow” branches.
(0.556, 0.555555…, 55.6%) (A1)(ft) (C3)
Note: Follow through marks may be awarded if their answer to part (a) is used in a correct calculation.
[3 marks]
(0.333, 0.333333…, 33.3%) (A1) (C1)
[1 mark]
Examiners report
The following Venn diagram shows the sets , , and .
is an element of .
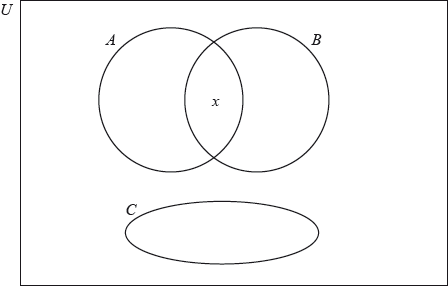
In the table indicate whether the given statements are True or False.

On the Venn diagram, shade the region .
Markscheme
* This question is from an exam for a previous syllabus, and may contain minor differences in marking or structure.
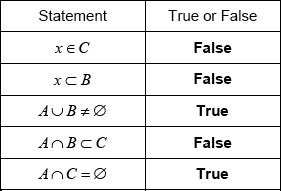 (A1)(A1)(A1)(A1)(A1) (C5)
[5 marks]
 (A1) (C1)
[1 mark]
Examiners report
Let and , for , where is a constant.
Find .
Given that , find the value of .
Markscheme
* This question is from an exam for a previous syllabus, and may contain minor differences in marking or structure.
attempt to form composite (M1)
eg
correct function A1 N2
eg
[2 marks]
evidence of (M1)
eg, graph with horizontal asymptote when
Note: Award M0 if candidate clearly has incorrect limit, such as .
evidence that (seen anywhere) (A1)
eg, graph of or
with asymptote , graph of composite function with asymptote
correct working (A1)
eg
A1 N2
[4 marks]
Examiners report
A college runs a mathematics course in the morning. Scores for a test from this class are shown below.
For these data, the lower quartile is and the upper quartile is .
The box and whisker diagram showing these scores is given below.

Test scores
Another mathematics class is run by the college during the evening. A box and whisker diagram showing the scores from this class for the same test is given below.

Test scores
A researcher reviews the box and whisker diagrams and believes that the evening class performed better than the morning class.
Show that the test score of would not be considered an outlier.
With reference to the box and whisker diagrams, state one aspect that may support the researcher’s opinion and one aspect that may counter it.
Markscheme
OR seen anywhere OR seen anywhere (M1)
A1
R1
so is not an outlier AG
[3 marks]
The median score for the evening class is higher than the median score for the morning class. A1
THEN
but the scores are more spread out in the evening class than in the morning class A1
OR
the scores are more inconsistent in the evening class A1
OR
the lowest scores are in the evening class A1
OR
the interquartile range is lower in the morning class A1
OR
the lower quartile is lower in the evening class A1
Note: If an incorrect comparison is also made, award at most A1A0.
Award A0 for a comparison that references “the mean score” unless working is shown for the estimated means of the data sets, calculated from the mid-points of the 4 intervals. The estimated mean for the morning class is and the estimated mean for the evening class is .
[2 marks]
Examiners report
There were mixed results calculating the boundary value for outliers. Some determined the correct value of 23, but did not relate it back to 25. Some did not realize that a calculation had to be performed, and instead tried to present an argument referencing the box and whisker diagram.
The majority of candidates were able to compare the medians as evidence supporting the researcher’s belief. However, some incorrectly referred to the median values as mean values. There were more counterarguments available to be presented, and again, candidates were generally able to communicate one of these. There were occasions where the candidate did not indicate which argument was in support of the researcher and which argument was the counterargument, which is an important element in the labelling/communication of their response.
As part of a study into healthy lifestyles, Jing visited Surrey Hills University. Jing recorded a person’s position in the university and how frequently they ate a salad. Results are shown in the table.

Jing conducted a 2 test for independence at a 5 % level of significance.
State the null hypothesis.
Calculate the -value for this test.
State, giving a reason, whether the null hypothesis should be accepted.
Markscheme
number of salad meals per week is independent of a person’s position in the university A1
Note: Accept “not associated” instead of independent.
[1 mark]
0.0201 (0.0201118…) A2
[2 marks]
0.0201 < 0.05 R1
the null hypothesis is rejected A1
Note: Award (R1) for a correct comparison of their -value to the test level, award (A1) for the correct interpretation from that comparison.
Do not award (R0)(A1).
[2 marks]
Examiners report
At the end of a school day, the Headmaster conducted a survey asking students in how many classes they had used the internet.
The data is shown in the following table.

The mean number of classes in which a student used the internet is 2.
State whether the data is discrete or continuous.
Find the value of .
It was not possible to ask every person in the school, so the Headmaster arranged the student names in alphabetical order and then asked every 10th person on the list.
Identify the sampling technique used in the survey.
Markscheme
discrete A1
[1 mark]
M1A1
Note: Award M1 for substitution into the formula for the mean, award A1 for a correct equation.
attempt to solve their equation (M1)
= 31 A1
[4 marks]
systematic A1
[1 mark]
Examiners report
Kayla wants to measure the extent to which two judges in a gymnastics competition are in agreement. Each judge has ranked the seven competitors, as shown in the table, where 1 is the highest ranking and 7 is the lowest.

Calculate Spearman’s rank correlation coefficient for this data.
State what conclusion Kayla can make from the answer in part (a).
Markscheme
average equal ranks M1
 A1A1
A1A1
A2
[5 marks]
There is strong agreement between the two judges. R1
[1 mark]
Examiners report
A group of 20 students travelled to a gymnastics tournament together. Their ages, in years, are given in the following table.
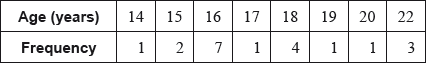
The lower quartile of the ages is 16 and the upper quartile is 18.5.
For the students in this group write down the median age.
Draw a box-and-whisker diagram, for these students’ ages, on the following grid.

Markscheme
16.5 (A1) (C1)
[1 mark]
 (A1)(A1)(A1)(ft) (C3)
Note: Award (A1) for correct endpoints, (A1) for correct quartiles, (A1)(ft) for their median. Follow through from part (a)(ii), but only if median is between 16 and 18.5. If a horizontal line goes through the box, award at most (A1)(A1)(A0). Award at most (A0)(A1)(A1) if a ruler has not been used.
[3 marks]
Examiners report
In a high school, 160 students completed a questionnaire which asked for the number of people they are following on a social media website. The results were recorded in the following box-and-whisker diagram.

The following incomplete table shows the distribution of the responses from these 160 students.

Write down the mid-interval value for the 100 < x ≤ 150 group.
Markscheme
125 (accept 125.5) (A1)
Examiners report
A health inspector analysed the amount of sugar in 500 different snacks prepared in various school cafeterias. The collected data are shown in the following box-and-whisker diagram.

Amount of sugar per snack in grams
The health inspector visits two school cafeterias. She inspects the same number of meals at each cafeteria. The data is shown in the following box-and-whisker diagrams.

Meals prepared in the school cafeterias are required to have less than 10 grams of sugar.
State, giving a reason, which school cafeteria has more meals that do not meet the requirement.
Markscheme
Cafeteria 2 (A1) (C1)
75 % > 50 % (do not meet the requirement) (R1) (C1)
OR
25 % < 50 % (meet the requirement) (R1) (C1)
Note: Do not award (A1)(R0). Award the (R1) for a correct comparison of percentages for both cafeterias, which may be in words. The percentage values or fractions must be seen. It is possible to award (A0)(R1).
[2 marks]
Examiners report
Stephen was invited to perform a piano recital. In preparation for the event, Stephen recorded the amount of time, in minutes, that he rehearsed each day for the piano recital.
Stephen rehearsed for days and data for all these days is displayed in the following box-and-whisker diagram.

Stephen states that he rehearsed on each of the days.
Write down the median rehearsal time.
State whether Stephen is correct. Give a reason for your answer.
On days, Stephen practiced exactly minutes.
Find the possible values of .
Markscheme
(minutes) (A1) (C1)
[1 mark]
Stephen is correct. (A1)
the minimum rehearsal time is greater than zero (R1)
OR
he rehearsed at least minutes every day (R1) (C2)
Note: Do not award (A1)(R0). Accept equivalent reasoning based on the box-and-whisker diagram.
[2 marks]
(A1)(A1)(A1) (C3)
Note: Award (A1)(A1) for each correct endpoint of the interval, (A1) for indication of integer values, except 1, between their endpoints.
[3 marks]