
HL Paper 2
An ice-skater is skating such that her position vector when viewed from above at time seconds can be modelled by
with respect to a rectangular coordinate system from a point , where the non-zero constants and can be determined. All distances are in metres.
At time , the displacement of the ice-skater is given by and the velocity of the ice‑skater is given by .
Find the velocity vector at time .
Show that the magnitude of the velocity of the ice-skater at time is given by
.
Find the value of and the value of .
Find the magnitude of the velocity of the ice-skater when .
At a point , the ice-skater is skating parallel to the -axis for the first time.
Find .
Consider the following system of coupled differential equations.
Find the value of
Find the eigenvalues and corresponding eigenvectors of the matrix .
Hence, write down the general solution of the system.
Determine, with justification, whether the equilibrium point is stable or unstable.
(i) at .
(ii) at .
Sketch a phase portrait for the general solution to the system of coupled differential equations for , .
A ball is attached to the end of a string and spun horizontally. Its position relative to a given point, , at time seconds, , is given by the equation
where all displacements are in metres.
The string breaks when the magnitude of the ball’s acceleration exceeds .
Show that the ball is moving in a circle with its centre at and state the radius of the circle.
Find an expression for the velocity of the ball at time .
Hence show that the velocity of the ball is always perpendicular to the position vector of the ball.
Find an expression for the acceleration of the ball at time .
Find the value of at the instant the string breaks.
How many complete revolutions has the ball completed from to the instant at which the string breaks?
A change in grazing habits has resulted in two species of herbivore, and , competing for food on the same grasslands. At time environmentalists begin to record the sizes of both populations. Let the size of the population of be , and the size of the population be . The following model is proposed for predicting the change in the sizes of the two populations:
for
For this system of coupled differential equations find
When has a population of .
It is known that has an initial population of .
the eigenvalues.
the eigenvectors.
Hence write down the general solution of the system of equations.
Sketch the phase portrait for this system, for .
On your sketch show
- the equation of the line defined by the eigenvector in the first quadrant
- at least two trajectories either side of this line using arrows on those trajectories to represent the change in populations as t increases
Write down a condition on the size of the initial population of if it is to avoid its population reducing to zero.
Find the value of at which .
Find the population of at this value of . Give your answer to the nearest herbivores.
A particle moves along the -axis. The velocity of is at time seconds, where for .
Find the times when is at instantaneous rest.
Find the magnitude of the particle’s acceleration at seconds.
Find the greatest speed of in the interval .
The particle starts from the origin . Find an expression for the displacement of from at time seconds.
Find the total distance travelled by in the interval .
A shock absorber on a car contains a spring surrounded by a fluid. When the car travels over uneven ground the spring is compressed and then returns to an equilibrium position.

The displacement, , of the spring is measured, in centimetres, from the equilibrium position of . The value of can be modelled by the following second order differential equation, where is the time, measured in seconds, after the initial displacement.
The differential equation can be expressed in the form , where is a matrix.
Given that , show that .
Write down the matrix .
Find the eigenvalues of matrix .
Find the eigenvectors of matrix .
Given that when the shock absorber is displaced and its velocity is zero, find an expression for in terms of .
The cross-sectional view of a tunnel is shown on the axes below. The line represents a vertical wall located at the left side of the tunnel. The height, in metres, of the tunnel above the horizontal ground is modelled by , relative to an origin .

Point has coordinates , point has coordinates , and point has coordinates .
Find the height of the tunnel when
Find .
Hence find the maximum height of the tunnel.
.
.
Use the trapezoidal rule, with three intervals, to estimate the cross-sectional area of the tunnel.
Write down the integral which can be used to find the cross-sectional area of the tunnel.
Hence find the cross-sectional area of the tunnel.
A particle moves such that its displacement, metres, from a point at time seconds is given by the differential equation
The equation for the motion of the particle is amended to
.
When the particle is stationary at .
Use the substitution to show that this equation can be written as
.
Find the eigenvalues for the matrix .
Hence state the long-term velocity of the particle.
Use the substitution to write the differential equation as a system of coupled, first order differential equations.
Use Euler’s method with a step length of to find the displacement of the particle when .
Find the long-term velocity of the particle.
The curve is shown in the graph, for .

The curve passes through the following points.

It is required to find the area bounded by the curve, the -axis, the -axis and the line .
One possible model for the curve is a cubic function.
Use the trapezoidal rule to find an estimate for the area.
Use all the coordinates in the table to find the equation of the least squares cubic regression curve.
Write down the coefficient of determination.
Write down an expression for the area enclosed by the cubic regression curve, the -axis, the -axis and the line .
Find the value of this area.
At an archery tournament, a particular competition sees a ball launched into the air while an archer attempts to hit it with an arrow.
The path of the ball is modelled by the equation
where is the horizontal displacement from the archer and is the vertical displacement from the ground, both measured in metres, and is the time, in seconds, since the ball was launched.
- is the horizontal component of the initial velocity
- is the vertical component of the initial velocity.
In this question both the ball and the arrow are modelled as single points. The ball is launched with an initial velocity such that and .
An archer releases an arrow from the point . The arrow is modelled as travelling in a straight line, in the same plane as the ball, with speed and an angle of elevation of .
Find the initial speed of the ball.
Find the angle of elevation of the ball as it is launched.
Find the maximum height reached by the ball.
Assuming that the ground is horizontal and the ball is not hit by the arrow, find the coordinate of the point where the ball lands.
For the path of the ball, find an expression for in terms of .
Determine the two positions where the path of the arrow intersects the path of the ball.
Determine the time when the arrow should be released to hit the ball before the ball reaches its maximum height.
A biologist introduces rabbits to an island and records the size of their population over a period of time. The population growth of the rabbits can be approximately modelled by the following differential equation, where is time measured in years.
A population of foxes is introduced to the island when the population of rabbits has reached . The subsequent population growth of rabbits and foxes, where is the population of foxes at time , can be approximately modelled by the coupled equations:
Use Euler’s method with a step size of , to find
The graph of the population sizes, according to this model, for the first years after the foxes were introduced is shown below.

Describe the changes in the populations of rabbits and foxes for these years at
Find the population of rabbits year after they were introduced.
(i) the population of rabbits 1 year after the foxes were introduced.
(ii) the population of foxes 1 year after the foxes were introduced.
point .
point .
Find the non-zero equilibrium point for the populations of rabbits and foxes.
Jorge is carefully observing the rise in sales of a new app he has created.
The number of sales in the first four months is shown in the table below.

Jorge believes that the increase is exponential and proposes to model the number of sales in month with the equation
Jorge plans to adapt Euler’s method to find an approximate value for .
With a step length of one month the solution to the differential equation can be approximated using Euler’s method where
Jorge decides to take the mean of these values as the approximation of for his model. He also decides the graph of the model should pass through the point .
The sum of the square residuals for these points for the least squares regression model is approximately .
Show that Jorge’s model satisfies the differential equation
Show that
Hence find three approximations for the value of .
Find the equation for Jorge’s model.
Find the sum of the square residuals for Jorge’s model using the values .
Comment how well Jorge’s model fits the data.
Give two possible sources of error in the construction of his model.
A student investigating the relationship between chemical reactions and temperature finds the Arrhenius equation on the internet.
This equation links a variable with the temperature , where and are positive constants and .
The Arrhenius equation predicts that the graph of against is a straight line.
Write down
The following data are found for a particular reaction, where is measured in Kelvin and is measured in :

Find an estimate of
Show that is always positive.
Given that and , sketch the graph of against .
(i) the gradient of this line in terms of ;
(ii) the -intercept of this line in terms of .
Find the equation of the regression line for on .
.
It is not required to state units for this value.
.
It is not required to state units for this value.
The voltage in a circuit is given by the equation
, where is measured in seconds.
The current in this circuit is given by the equation
.
The power in this circuit is given by .
The average power in this circuit from to is given by the equation
, where .
Write down the maximum and minimum value of .
Write down two transformations that will transform the graph of onto the graph of .
Sketch the graph of for 0 ≤ ≤ 0.02 , showing clearly the coordinates of the first maximum and the first minimum.
Find the total time in the interval 0 ≤ ≤ 0.02 for which ≥ 3.
Find (0.007).
With reference to your graph of explain why > 0 for all > 0.
Given that can be written as where , , , > 0, use your graph to find the values of , , and .
Consider the system of paired differential equations
.
This represents the populations of two species of symbiotic toadstools in a large wood.
Time is measured in decades.
Use the eigenvalue method to find the general solution to this system of equations.
Given the initial conditions that when , , , find the particular solution.
Hence find the solution when .
As , find an asymptote to the trajectory of the particular solution found in (b)(i) and state if this trajectory will be moving towards or away from the origin.
Consider the curve .
The shape of a piece of metal can be modelled by the region bounded by the functions , , the -axis and the line segment , as shown in the following diagram. The units on the and axes are measured in metres.

The piecewise function is defined by
The graph of is obtained from the graph of by:
- a stretch scale factor of in the direction,
- followed by a stretch scale factor in the direction,
- followed by a translation of units to the right.
Point lies on the graph of and has coordinates . Point is the image of under the given transformations and has coordinates .
The piecewise function is given by
The area enclosed by , the -axis and the line is correct to six significant figures.
Find .
Hence show that the equation of the tangent to the curve at the point is .
Find the value of and the value of .
Find an expression for.
Find the value of .
Find the value of .
Find the area enclosed by , the -axis and the line .
Find the area of the shaded region on the diagram.
A sector of a circle, centre and radius , is shown in the following diagram.

A square field with side has a goat tied to a post in the centre by a rope such that the goat can reach all parts of the field up to from the post.

[Source: mynamepong, n.d. Goat [image online] Available at: https://thenounproject.com/term/goat/1761571/
This file is licensed under the Creative Commons Attribution-ShareAlike 3.0 Unported (CC BY-SA 3.0)
https://creativecommons.org/licenses/by-sa/3.0/deed.en [Accessed 22 April 2010] Source adapted.]
Let be the volume of grass eaten by the goat, in cubic metres, and be the length of time, in hours, that the goat has been in the field.
The goat eats grass at the rate of .
Find the angle .
Find the area of the shaded segment.
Find the area of the field that can be reached by the goat.
Find the value of at which the goat is eating grass at the greatest rate.
The goat is tied in the field for hours.
Find the total volume of grass eaten by the goat during this time.
Consider the function .
Consider the region bounded by the curve , the -axis and the lines .
Show that the -coordinate of the minimum point on the curve satisfies the equation .
Determine the values of for which is a decreasing function.
Sketch the graph of showing clearly the minimum point and any asymptotic behaviour.
Find the coordinates of the point on the graph of where the normal to the graph is parallel to the line .
This region is now rotated through radians about the -axis. Find the volume of revolution.
An environmental scientist is asked by a river authority to model the effect of a leak from a power plant on the mercury levels in a local river. The variable measures the concentration of mercury in micrograms per litre.
The situation is modelled using the second order differential equation
where is the time measured in days since the leak started. It is known that when and .
If the mercury levels are greater than micrograms per litre, fishing in the river is considered unsafe and is stopped.
The river authority decides to stop people from fishing in the river for longer than the time found from the model.
Show that the system of coupled first order equations:
can be written as the given second order differential equation.
Find the eigenvalues of the system of coupled first order equations given in part (a).
Hence find the exact solution of the second order differential equation.
Sketch the graph of against , labelling the maximum point of the graph with its coordinates.
Use the model to calculate the total amount of time when fishing should be stopped.
Write down one reason, with reference to the context, to support this decision.
A water trough which is 10 metres long has a uniform cross-section in the shape of a semicircle with radius 0.5 metres. It is partly filled with water as shown in the following diagram of the cross-section. The centre of the circle is O and the angle KOL is radians.
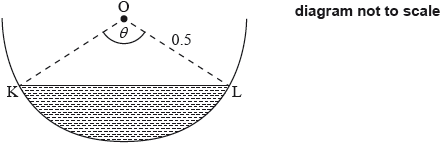
The volume of water is increasing at a constant rate of .
Find an expression for the volume of water in the trough in terms of .
Calculate when .
Charlotte decides to model the shape of a cupcake to calculate its volume.

From rotating a photograph of her cupcake she estimates that its cross-section passes through the points and , where all units are in centimetres. The cross-section is symmetrical in the -axis, as shown below:

She models the section from to as a straight line.
Charlotte models the section of the cupcake that passes through the points and with a quadratic curve.
Charlotte thinks that a quadratic with a maximum point at and that passes through the point would be a better fit.
Believing this to be a better model for her cupcake, Charlotte finds the volume of revolution about the -axis to estimate the volume of the cupcake.
Find the equation of the line passing through these two points.
Find the equation of the least squares regression quadratic curve for these four points.
By considering the gradient of this curve when , explain why it may not be a good model.
Find the equation of the new model.
Write down an expression for her estimate of the volume as a sum of two integrals.
Find the value of Charlotte’s estimate.
Consider
The function is defined by
The function is defined by .
Find the largest possible domain for to be a function.
Sketch the graph of showing clearly the equations of asymptotes and the coordinates of any intercepts with the axes.
Explain why is an even function.
Explain why the inverse function does not exist.
Find the inverse function and state its domain.
Find .
Hence, show that there are no solutions to ;
Hence, show that there are no solutions to .
Consider the function .
Let .
Determine an expression for in terms of .
Sketch a graph of for .
Find the -coordinate(s) of the point(s) of inflexion of the graph of , labelling these clearly on the graph of .
Express in terms of .
Express in terms of .
Hence show that can be expressed as .
Solve the equation , giving your answers in the form where .
A point P moves in a straight line with velocity ms−1 given by at time t seconds, where t ≥ 0.
Determine the first time t1 at which P has zero velocity.
Find an expression for the acceleration of P at time t.
Find the value of the acceleration of P at time t1.
A curve C is given by the implicit equation .
The curve intersects C at P and Q.
Show that .
Find the coordinates of P and Q.
Given that the gradients of the tangents to C at P and Q are m1 and m2 respectively, show that m1 × m2 = 1.
Find the coordinates of the three points on C, nearest the origin, where the tangent is parallel to the line .
The following graph shows the two parts of the curve defined by the equation , and the normal to the curve at the point P(2 , 1).

Show that there are exactly two points on the curve where the gradient is zero.
Find the equation of the normal to the curve at the point P.
The normal at P cuts the curve again at the point Q. Find the -coordinate of Q.
The shaded region is rotated by 2 about the -axis. Find the volume of the solid formed.
A function satisfies the conditions , and its second derivative is , ≥ 0.
Find .
Xavier, the parachutist, jumps out of a plane at a height of metres above the ground. After free falling for 10 seconds his parachute opens. His velocity, , seconds after jumping from the plane, can be modelled by the function
His velocity when he reaches the ground is .
Find his velocity when .
Calculate the vertical distance Xavier travelled in the first 10 seconds.
Determine the value of .
The region is enclosed by the graph of , the -axis and the line .
Write down a definite integral to represent the area of .
Calculate the area of .
The function is defined by , ≥ 1 and the function is defined by , ≥ 0.
The region is bounded by the curves , and the lines , and as shown on the following diagram.

The shape of a clay vase can be modelled by rotating the region through 360˚ about the -axis.
Find the volume of clay used to make the vase.
The curve is defined by equation .
Find in terms of and .
Determine the equation of the tangent to at the point
An object is placed into the top of a long vertical tube, filled with a thick viscous fluid, at time seconds.
Initially it is thought that the resistance of the fluid would be proportional to the velocity of the object. The following model was proposed, where the object’s displacement, , from the top of the tube, measured in metres, is given by the differential equation
.
The maximum velocity approached by the object as it falls is known as the terminal velocity.
An experiment is performed in which the object is placed in the fluid on a number of occasions and its terminal velocity recorded. It is found that the terminal velocity was consistently smaller than that predicted by the model used. It was suggested that the resistance to motion is actually proportional to the velocity squared and so the following model was set up.
At terminal velocity the acceleration of an object is equal to zero.
By substituting into the equation, find an expression for the velocity of the particle at time . Give your answer in the form .
From your solution to part (a), or otherwise, find the terminal velocity of the object predicted by this model.
Write down the differential equation as a system of first order differential equations.
Use Euler’s method, with a step length of 0.2, to find the displacement and velocity of the object when .
By repeated application of Euler’s method, find an approximation for the terminal velocity, to five significant figures.
Use the differential equation to find the terminal velocity for the object.
Use your answers to parts (d), (e) and (f) to comment on the accuracy of the Euler approximation to this model.
An earth satellite moves in a path that can be described by the curve where and are in thousands of kilometres and is time in seconds.
Given that when , find the possible values of .
Give your answers in standard form.
The function is defined by , 0 < < 3.
Draw a set of axes showing and values between −3 and 3. On these axes
Find .
Hence, or otherwise, find the coordinates of the point of inflexion on the graph of .
sketch the graph of , showing clearly any axis intercepts and giving the equations of any asymptotes.
sketch the graph of , showing clearly any axis intercepts and giving the equations of any asymptotes.
Hence, or otherwise, solve the inequality .
A particle moves along a horizontal line such that at time seconds, ≥ 0, its acceleration is given by = 2 − 1. When = 6 , its displacement from a fixed origin O is 18.25 m. When = 15, its displacement from O is 922.75 m. Find an expression for in terms of .
Let be the tangent to the curve at the point (1, ).
Find the coordinates of the point where meets the -axis.