 IB Docs (2) Team

Contribution

Oyster vendor at Greenwich Market, London, UK
Break-even exists when a firm’s sales revenues cover all of its production costs. The break-even quantity (BEQ) is the level of output where a business does not make either a profit or a loss. The formula for calculating the BEQ is:

This can be demonstrated by using the numerical example below for a seller of oysters at a stall in Greenwich Market, London, UK:
The average price of each oyster is £1.25
The variable cost of each oyster (sometimes referred to as the cost of sales) is £0.45
The vendor’s rent (its only fixed costs) is £200 per week
So, the BEQ = £200 ÷ (£1.25 – £0.45) = 250 oysters to reach break-even
At this level of output, the total revenue = £1.25 × 250 = £312.50
If the firm sells 250 oysters, the total costs = £200 + (£0.45 × 250) = £200 + £112.50 = £312.50
Hence, the firm will break even at 250 units (250 oysters) as the TR = TC = £312.50.
This situation can be represented using a break-even chart, as illustrated below:
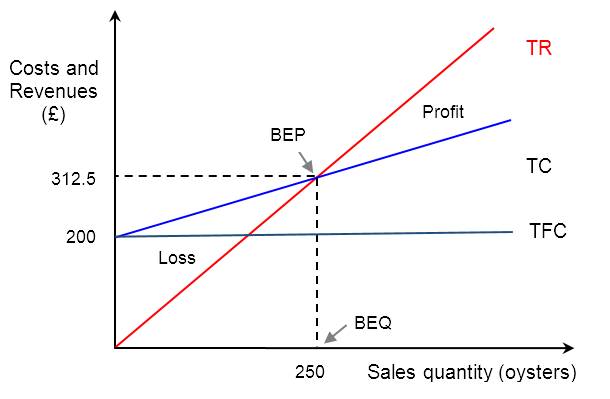
The diagram shows the following:
Costs and revenues are measured on the y-axis, expressed in terms of a currency (in this case, pounds sterling or "£").
Sales volume (or quantity of sales) is measured along the x-axis (in this case, the number of oysters).
The total revenue (TR) line, which shows that the more units sold, the higher the sales revenue. Notice the TR line starts at zero (there is no revenue earned if no units of output are sold) and that the gradient of the line is equal to the selling price.
The total cost (TC) line, which starts at the same value of fixed costs. This is because the firm still has to pay fixed costs even if no output is sold. Note the gradient of the TC line is the same as the value of unit variable costs.
The break-even point (BEP) occurs at the point where the TR line intersects the TC line, i.e., where TR = TC.
The break-even quantity (BEQ) is shown along the x-axis as quantity is measured on this axis in the diagram.
Any volume of sales (quantity) to the left of the BEQ represents a loss for the firm. Any volume of sales to the right of the BEQ represents profit for the firm as it has sold more units than needed to break-even.
Contribution (total contribution and contribution per unit) is important to understanding break-even analysis. The difference between a firm’s selling price (P) and its average variable cost (AVC) is known as the unit contribution (or contribution per unit). This represents the amount of money earned from each unit of the product sold to customers.
The formula for calculating contribution per unit is: P – AVC, where P = price and AVC = average variable cost.
In the above example, for each oyster sold, the vendor earns £1.25 – £0.45 = £0.80
So, for each oyster sold, the vendor earns £0.80 (80 pence) towards paying the firm's fixed costs.
The market stall vendor will need to sell 250 oysters in order to pay for the weekly rent of £200, i.e. £0.80 × 250 = £200.
The positive difference between a firm’s selling price and its average variable cost is used to pay (or contribute to) its fixed costs. Hence, break-even occurs when a firm’s total contribution equals it total fixed costs.
Total contribution is simply the unit contribution (P – AVC) multiplied by the quantity sold (Q), i.e. Total contribution = (P – AVC) × Q.
Total contribution can be used to calculate profit or loss by taking away fixed costs from total contribution, i.e. Profit = [(P – AVC) × Q] – TFC.
Common mistake
Contribution is not the same as value added, although the two terms are often confused by students:
Unit contribution = Price minus Average variable cost, i.e. P – AVC
Value added per unit = Price minus Average total costs, i.e. P – ATC
This means that value added considers both variable and fixed costs of production, whereas unit contribution only considers the cost of sales (COS) or the variable costs.
To test your understanding of this topic, have a go at the following exam practice question.
Exam Practice Question - Heather Manetta's Hotdogs

Heather Manetta is a hotdog vendor. She sells hotdogs for $10 each and has unit variable costs of $6. She pays $2,000 rent per month. On average, she sells 1,500 hotdogs per month.
| (a) | Calculate Heather Manetta's contribution per unit. | [2 marks] |
| (b) | Calculate Heather Manetta's total contribution per month. | [2 marks] |
| (c) | Calculate Heather Manetta's break-even quantity. | [2 marks] |
| (d) | Calculate Heather Manetta's average profit per month. | [2 marks] |
Answers
For each question, award [1 mark] for the correct answer and [1 mark] for showing appropriate working out.
(a) Calculate Heather Manetta's contribution per unit. [2 marks]
$10 – $6 = $4 contribution per unit.
(b) Calculate Heather Manetta's total contribution per month. [2 marks]
$4 × 1,500 hotdogs = total contribution of $6,000 per month
(c) Calculate Heather Manetta's break-even quantity. [2 marks]
BEQ = $2,000 / ($10 – $6) = 500 hotdogs per month
(d) Calculate Heather Manetta's average profit per month. [2 marks]
Profit = Total contribution – Fixed costs = $6,000 – $2,000 = $4,000
Back to the Unit 5.5 - Break-even analysis homepage
Back to the Unit 5 - Operations Management homepage
![]()
 Twitter
 Facebook
 LinkedIn